
Ecommerce Marketing Strategy Guide — Full Funnel, Data, and Platform
 임재복
임재복
Ecommerce marketing isn’t about buying visitors with ads — it’s about breaking down the four levers of the growth formula, revenue = traffic × conversion rate × average order value × repeat purchase, into data, and fixing whichever lever is weakest. The execution order comes down to three steps. First, break down the growth formula to diagnose your bottleneck lever. Second, place channels and content across the entire customer journey — awareness → exploration → purchase → repeat purchase → referral. Third, don’t stop at new customer acquisition — build a structure where repeat purchases and customer lifetime value (LTV) accumulate. Without this structure, increasing ad spend alone means revenue disappears the moment you turn ads off; with the structure in place, revenue accumulates on the same budget.
The market itself is plenty big. According to Statistics Korea’s (now the National Data Agency’s) Online Shopping Trends report, online shopping transactions in January 2026 totaled KRW 24.1004 trillion, up 8.6% year over year, with mobile transactions accounting for 78.2% of that. The problem isn’t the market — it’s structure. In the exact same market, some online stores lose more money the more they spend on ads, while other brands grow through repeat purchase even as they cut ad spend. This guide lays out the ecommerce marketing strategy that creates that difference, in order: growth formula breakdown, full-funnel design, data operations, platform selection, ad management principles, and common failure patterns. Every figure in this article is drawn only from verified sources.
The Ecommerce Growth Formula — Revenue Breaks Down Into Four Levers
Every dollar of ecommerce revenue breaks down into one line:
Revenue = Traffic (visits) × Conversion rate (CVR) × Average order value (AOV) × Repeat purchase (purchase frequency)
This breakdown matters for two reasons. First, the vague goal of “increase revenue” turns into the measurable question of “which lever should we move, and by how much.” Second, the four levers are connected by multiplication, so small improvements compound. Improve each lever by just 10%, and revenue grows by 1.1 × 1.1 × 1.1 × 1.1 ≈ 1.46x — roughly 46%. Improving all four levers by 10% each costs far less than growing traffic alone by 46%, and the effect lasts longer.
So the first task in ecommerce marketing isn’t planning ad creative — it’s diagnosis. Measure the current value of each lever, find which one lags furthest behind industry benchmarks, and concentrate budget and experiments on that bottleneck. It’s essentially applying the bottleneck optimization principle from data science directly to marketing.
| Lever | Core metric | Representative improvement strategy | Common misconception |
|---|---|---|---|
| Traffic | Sessions by channel, customer acquisition cost (CAC) | SEO/content, search & social ads, experience-group/review-driven discovery, CRM return visits | “More visitors means more revenue” — traffic without purchase intent is just cost |
| Conversion rate (CVR) | Purchase conversion rate, cart abandonment rate, checkout completion rate | Enriching product pages and reviews, simplifying checkout steps, A/B testing | “Conversion is a product problem” — fixing checkout UX and trust signals alone can move it |
| Average order value (AOV) | Average order amount, items per order | Sets and bundles, upsell/cross-sell, free-shipping thresholds | “Selling at a higher price won’t sell” — changing the offer configuration raises AOV without price resistance |
| Repeat purchase | Repeat purchase rate, purchase cycle, LTV | Post-first-purchase onboarding, CRM messaging, membership/subscription, review-to-repeat loops | “A good product sells itself again” — repeat purchase you didn’t design for is just luck |
Which Lever Should You Fix First? — Three Steps to Diagnosis
Here’s the order for finding your bottleneck. First, measure — using the last 3–6 months of data, measure the current value of each lever broken out by channel (looking at the overall average hides the bottleneck; you need a channel × lever matrix to see it). Second, compare — compare against typical benchmarks for your category and price range, and against your own historical trend, to find the lever that’s furthest behind. Third, focus — concentrate experiments and budget on one bottleneck lever per quarter. Touch all four levers at once and you’ll never know what actually worked, which erases the basis for next quarter’s decisions.
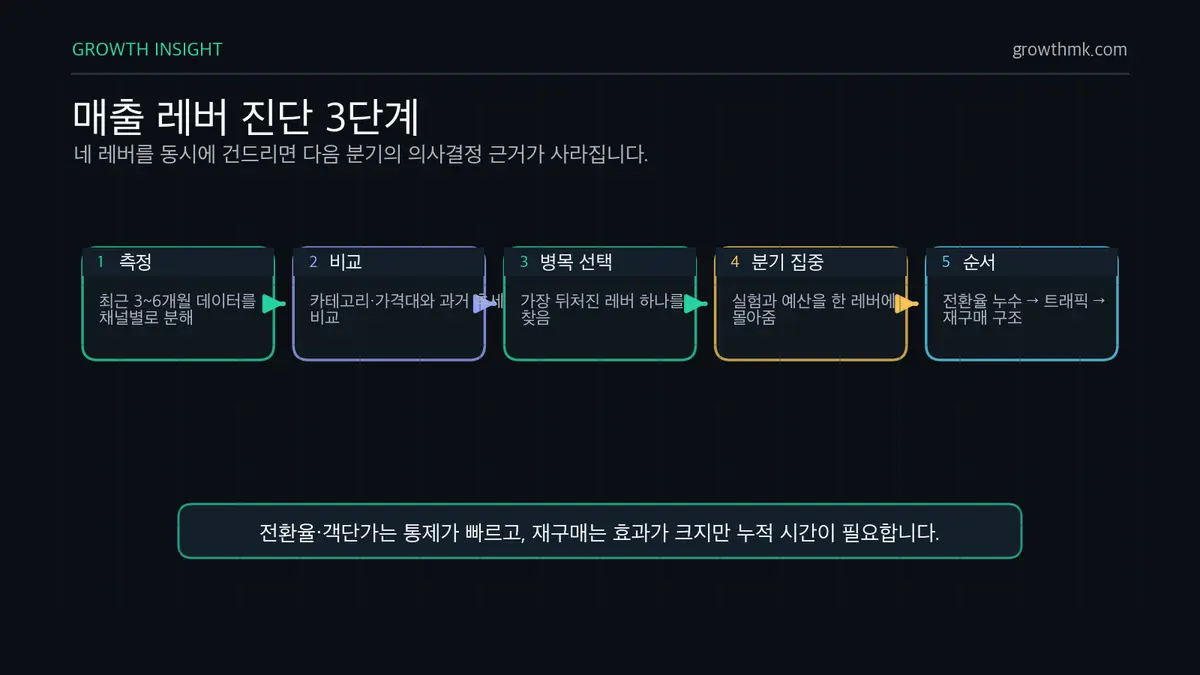
Each lever also differs in how hard it is to move. Generally, conversion rate and AOV can be controlled within your own site and improve quickly; traffic costs money; and repeat purchase has the biggest effect but takes the longest to build. In practice, the order that loses the least is: plug conversion-rate leaks first (so the traffic you already have doesn’t slip away), then grow traffic, then build repeat-purchase structure in parallel.
Traffic — Purchase Intent Is the Standard, Not Volume
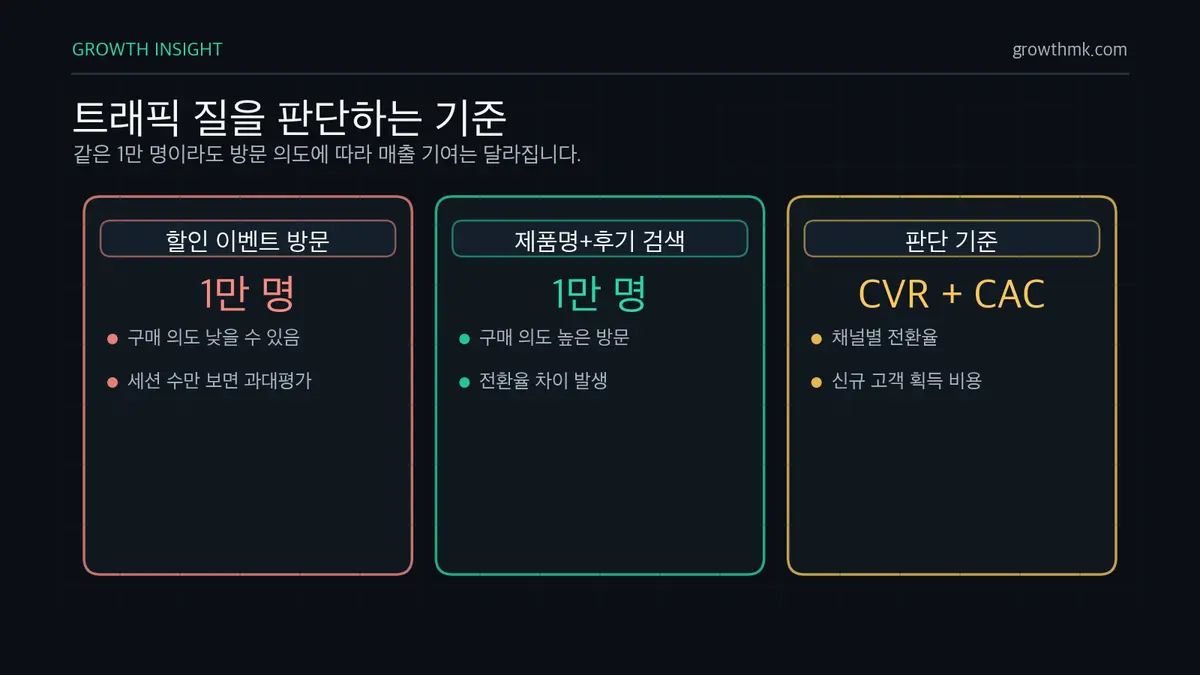
The first thing to check on the traffic lever isn’t visitor count — it’s visitor quality. Even with the same 10,000 visitors, traffic pulled in by a discount campaign and traffic that arrived by searching “[product name] + reviews” can differ in conversion rate by several multiples. Instead of looking only at session counts in your channel reports, put channel-level conversion rate and customer acquisition cost (CAC) side by side — and it immediately becomes clear which channels are actually driving revenue-generating traffic.
Conversion Rate — Start by Plugging the Point Where 7 in 10 Carts Are Abandoned
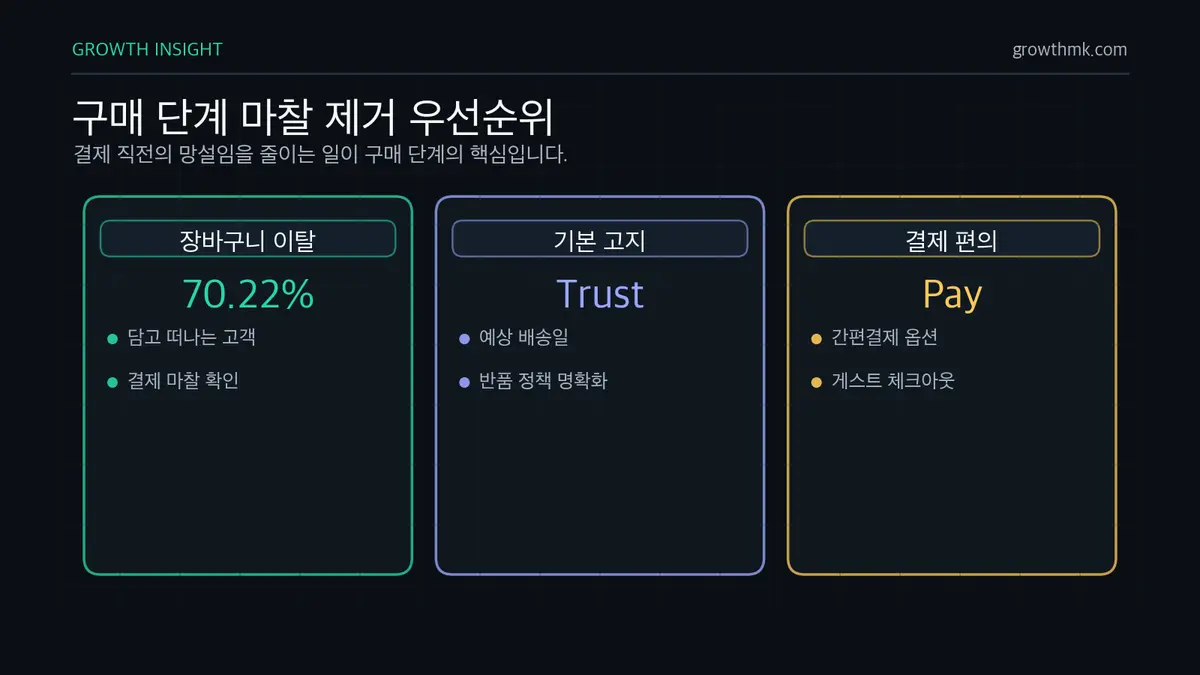
The biggest leak on the conversion-rate lever is the shopping cart. The UX research firm Baymard Institute, synthesizing 50 studies, found an average cart abandonment rate of 70.22% — meaning 7 out of 10 customers who add an item to their cart leave before checking out. The usual culprits are unexpected extra costs (shipping, fees), forced account creation, and complicated checkout steps. Even just adding cart-abandonment reminder messages, allowing guest checkout, and disclosing shipping costs upfront can meaningfully cut the leakage at this stage.
Average Order Value — It’s About Order Composition, Not Raising Prices
AOV isn’t a lever you pull by raising prices — it’s a lever you pull by designing order composition. The typical moves are bundling consumables with the core product, cross-selling additional items at the cart stage, and setting a free-shipping threshold above a certain order amount. If your average order value is KRW 42,000, setting the free-shipping threshold at KRW 50,000, for example, is a matter of working the threshold backward from the data.
Repeat Purchase — The Most Undervalued Lever
Of the four levers, repeat purchase is the one Korean ecommerce businesses neglect most. It doesn’t show up on the ad dashboard, and its effect is cumulative, so it doesn’t produce a visible result right away. Yet repeat purchase is the only lever that generates revenue without any additional acquisition cost, and it’s the key to breaking the ‘new-traffic addiction’ we’ll cover below.
Full-Funnel Customer Journey Design — Every Stage Answers a Different Question
If lever diagnosis tells you what to fix, full-funnel design tells you where to place it. Customers don’t buy after a single ad impression. As the Customer Decision Journey (CDJ) shows, they move through awareness → exploration → purchase → repeat purchase → referral, and the question in their head is different at every stage. Marketing’s job is to have the right channel and content ready in advance for each stage’s question.
The exploration stage in particular isn’t a straight line. Google’s consumer behavior research calls the gap between search and purchase the ‘messy middle’. Consumers cycle repeatedly between two modes — exploration, which widens their options, and evaluation, which narrows them — until they finally decide to buy. Among the purchase drivers this research identifies, the ones most directly tied to ecommerce are social proof (reviews, recommendations), authority (expert or trusted sources), category heuristics (summarized key specs), and immediacy (fast shipping). That’s why brands with abundant reviews and comparison content tend to win this loop.
| Stage | Customer’s question | Core channels | Content/tactics | Core metrics |
|---|---|---|---|---|
| Awareness | “Did a product like this exist?” | Social/Shorts, influencers/experience groups, display ads | Problem-framing content, real-use videos, UGC | Reach, new visits, brand search volume |
| Exploration | “Is it better than the alternatives? Can I trust it?” | Search (SEO)/blog, YouTube reviews, comparison content | Reviews and ratings, comparison tables, ingredient/spec guides | Search traffic, product-page dwell time, wishlist/cart adds |
| Purchase | “Would I regret buying this right now?” | Owned store/marketplace, retargeting, cart reminders | Simplified checkout UX, shipping/return policy disclosure, first-purchase perks | Conversion rate, cart abandonment rate, checkout completion rate |
| Repeat purchase | “Is there a reason to buy again?” | CRM (KakaoTalk alerts/email/app push), membership | First-purchase onboarding, refill reminders tied to usage cycle, tier perks | Repeat purchase rate, purchase cycle, LTV |
| Referral | “Who do I want to tell?” | Review platforms, friend referral, community | Photo-review rewards, referral rewards, customer interviews | Review count/rating, referral sign-ups/purchases |
Awareness and Exploration — Build a Review Asset Before You Spend on Ads
A common mistake at the awareness stage is reporting exposure metrics like views and reach as if they were results. Whether awareness spend actually worked has to be confirmed through changes in brand search volume and direct traffic. If a video gets a million views but branded search doesn’t increase, the content got consumed but the brand wasn’t remembered.
At the exploration stage, the single strongest weapon inside the messy middle is social proof. If you’re a new store, building up review and content assets before scaling ad spend is what makes ad efficiency rise in turn. Experience-group marketing is effective for securing early reviews, and comparison- or guide-style content marketing is the longest-lasting investment for capturing search demand at the exploration stage. Turn off ads and they stop; content that ranks in search and accumulated reviews keep working.
Purchase — It’s All About Removing Hesitation
There’s really one design principle at the purchase stage: remove hesitation points one by one, right up to the moment of checkout. Showing expected delivery dates, clearly disclosing return policy, offering simple-payment options, and allowing guest checkout are the basics. The 70.22% cart abandonment rate cited above is driven largely not by dislike of the product but by friction in the checkout process. Reminder messages sent to customers who added to cart and left are one of the most consistently proven-effective scenarios in ecommerce CRM.
Repeat Purchase and Referral — Not the End of the Funnel, But the Entrance to the Next One
Repeat purchase and referral aren’t the bottom of the funnel — they’re the entrance to the next one. In practice, there are four high-priority CRM scenarios.
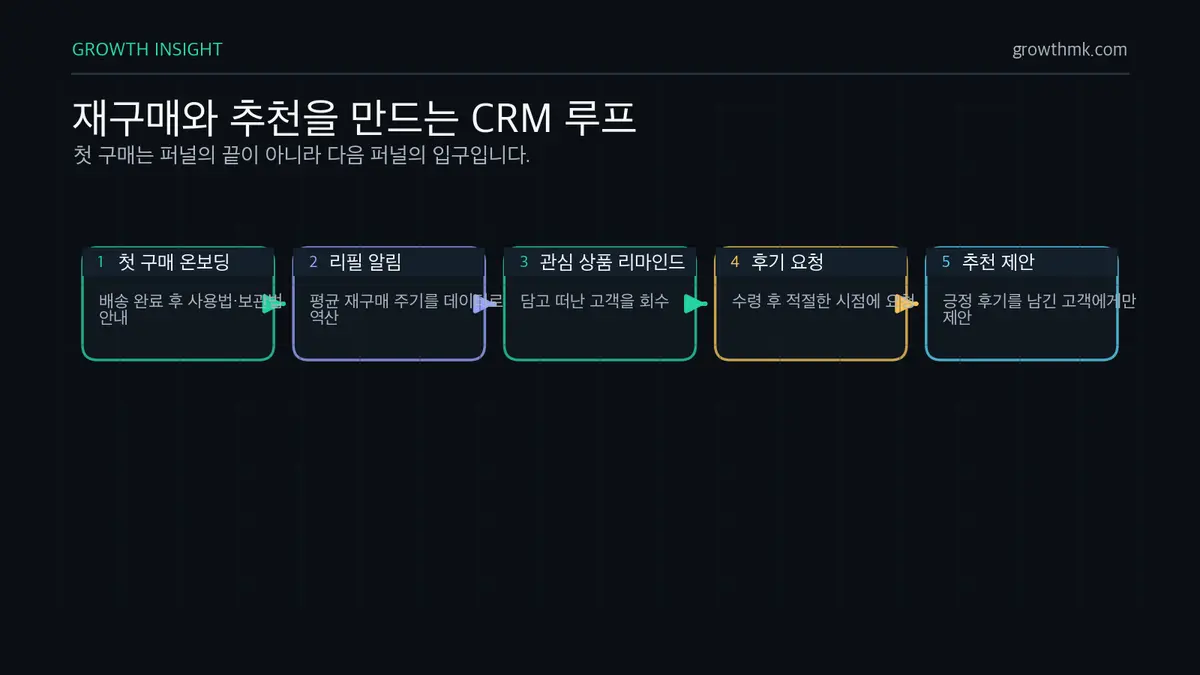
- First-purchase onboarding — Send usage and storage instructions right after delivery. Satisfaction with that first-use experience is the first gate that determines the odds of a repeat purchase.
- Refill reminders tied to the usage cycle — Work backward from the data to find each product’s average repeat-purchase cycle, and send a reminder right before the product is expected to run out. Especially effective for cosmetics, food, and consumable categories.
- Cart and wishlist reminders — Recovery messages for customers who added an item and left, or who’ve viewed the same product multiple times.
- Connecting review requests to referral offers — Ask for a review at the right moment after delivery, and only offer a friend-referral incentive to customers who left a positive review. Asking for a referral from a customer whose satisfaction you’ve already confirmed raises both response rate and referral quality.
Build this loop, and a single customer brings in both review assets and new customers; once the loop starts turning, dependence on awareness-stage ad spend structurally decreases.
Why Does ‘New-Traffic Addiction’ Wreck Online Stores?
Many online stores’ marketing meetings start and end with “how do we grow new visits this month.” Ad spend → new visits → first purchase → ad spend again next month. We call being stuck in this cycle alone ‘new-traffic addiction.’ The problem is that this structure gets worse over time. Bidding competition keeps pushing CAC up, and without a repeat-purchase structure, you have to re-buy every dollar of revenue from scratch every single time. A business whose revenue drops to zero the moment it stops advertising doesn’t have an asset — it has a spending habit.
The numbers make the difference obvious. Below is a simplified illustrative example (assuming CPC of KRW 600 and a 40% contribution margin).
| A. 10,000 new visits bought with ads | B. 100 repeat customers | |
|---|---|---|
| Marketing cost | KRW 6,000,000 (KRW 600 CPC × 10,000 clicks) | Under a few hundred thousand KRW (CRM messaging cost) |
| Purchases | 120 (1.2% conversion rate) | 100 (already-trusting customers) |
| Revenue | KRW 6,000,000 (AOV of KRW 50,000) | KRW 6,000,000 (repeat-purchase AOV of KRW 60,000) |
| Contribution margin − marketing cost | About −KRW 3,600,000 (2.4M − 6M) | About +KRW 2,300,000 (2.4M − messaging cost) |
Same KRW 6,000,000 in revenue, but one side is a loss and the other a profit. The 100 customers who came back contribute more to the bottom line than the 10,000 visits bought with ads. This is the perspective we consistently talk about — it’s not about the volume of traffic, but about bringing in, and keeping, the one visitor who becomes revenue.
External evidence points the same direction. According to the Harvard Business Review, acquiring a new customer costs 5 to 25 times more than retaining an existing one, and the Bain & Company research by Frederick Reichheld cited in that same article reports that a 5-percentage-point increase in customer retention boosts profit by 25% to 95%. Retention and repeat purchase aren’t ‘nice-to-have marketing’ — they’re dramatically more efficient in terms of unit economics than new acquisition.
There’s one more side effect of new-traffic addiction: discount dependence. Since the easiest way to quickly grow new visits is a discount promotion, the pattern of pairing ads with discounts tends to solidify. The problem is the character of the customer pool this builds. Customers acquired through discounts responded to the price, not the brand, so they’re much less likely to repeat-purchase at full price — and you end up having to offer even bigger discounts to drive next month’s revenue. If your revenue chart holds steady while your margin chart declines every quarter, you’re likely already inside this vicious cycle.
Don’t misread this. It doesn’t mean new customer acquisition is bad — it means new acquisition without a repeat-purchase structure is a leaky bucket. Just flip the order: define the first purchase as ‘the start of a relationship,’ not ‘the completion of acquisition,’ design the first 30 days of experience after that purchase (delivery, onboarding, first CRM message), and only then scale new traffic. That way, ad spend gets recovered as LTV instead of as one-off revenue. The judgment criterion is the LTV:CAC ratio — tracking, by channel, whether the contribution margin a customer generates over their lifetime sufficiently exceeds the cost of acquiring them (a ratio of 3x or higher is generally considered healthy) reveals which channels’ new acquisition is genuinely worth the money.
The Basics of Data Operations — Look at Segments, Not Averages
The sentence “our repeat purchase rate is 15%” tells you nothing on its own, because that 15% blends customers who buy twice a month with customers who bought once a year ago and never came back. Averages don’t help you decide — they hide the decision. The starting point of ecommerce data operations isn’t an elaborate dashboard; it’s two basic techniques for viewing customers by segment instead of by average: RFM and cohorts.
RFM — A Classification Method for Deciding Who Gets What
RFM is a classic but still highly practical way to rank customers on three axes: Recency (how recently they last purchased), Frequency (how often they buy), and Monetary (how much they spend). Combining scores across the three axes lets you break out of “one message to everyone” CRM and design different actions for different segments.
| Segment | Definition (example) | Priority action |
|---|---|---|
| VIP | Recent purchase + high frequency + high spend | Tier perks, early access to new products to prevent churn, referral program offer |
| High-potential customers | Recent purchase + low frequency | Drive a second purchase — related-product suggestions, refill reminders tied to usage cycle |
| At-risk customers | Previously high frequency, but recency has dropped | Win-back messages, churn-reason surveys, return-visit incentives |
| Dormant customers | No purchase for a long time | Minimize contact frequency, low-cost channels only — exclude from ad retargeting |
The last row deserves attention: RFM tells you not just who to target, but who not to. Simply excluding dormant customers with low odds of returning from your retargeting audience reduces wasted ad spend.
Cohorts — The Only Way to Confirm an Improvement Is Real
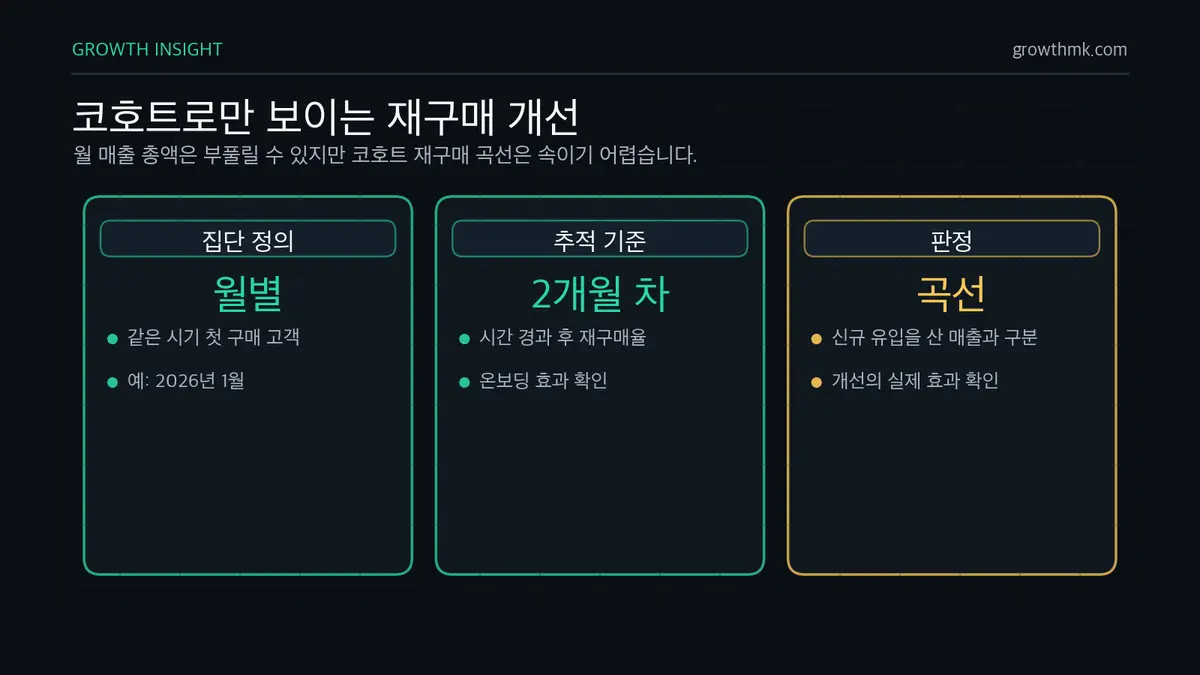
Cohort analysis groups customers who made their first purchase during the same period (say, first-time buyers in January 2026) and tracks what percentage of them repeat-purchase over time. Total monthly revenue can always be inflated by spending more on ads, but a cohort’s repeat-purchase curve can’t be faked. If the two-month repeat-purchase rate for the March cohort is higher than for the January cohort, your onboarding improvements actually worked; if the curve stays flat, the revenue increase just means you bought more new traffic. This distinction is exactly why the AARRR framework in growth hacking checks Activation and Retention before Acquisition.
Both analyses assume solid measurement infrastructure. If your own site’s conversion tracking (GA4 ecommerce events, ad pixels, Conversion API) is broken, RFM, cohorts, and ad automation all end up learning from bad data. Missing or duplicate checkout-completion events in particular contaminate every downstream analysis, so before you start analyzing, reconcile the actual order count in your order management system against the purchase-event count in your tracking tools to check the error rate first.
You can start light. With just order data (order date, customer ID, amount), you can build RFM tiers and a monthly cohort table in a spreadsheet. The hands-on process of designing RFM scores and building cohort charts is substantial enough that we’ll cover it step by step in a separate article.
Platform Strategy — Owned Store or Marketplace: Where Should You Focus?
“Should we list on a marketplace like a smart-store platform or a major open market, or should we build up our own store?” is one of the most common questions in online store marketing. The short answer: it’s not an either/or choice, it’s a question of designing the mix by stage. The two platform types have opposite strengths.
| Criterion | Owned store (D2C) | Marketplace (open market/general mall) |
|---|---|---|
| Initial traffic | You have to build it yourself (ads, SEO, content) | The platform already has it — exposure the moment you list |
| Fees/margin | Roughly payment-processing fee levels — easier to protect margin | Selling fees and ad spend eat into margin |
| Customer data | Owned — enables contact-list- and purchase-history-based CRM | Mostly not provided — hard to re-contact buyers |
| Repeat purchase/LTV design | Can build membership, subscription, CRM loops | Repeat purchase within the platform is the platform’s asset, not the brand’s |
| Price competition | No side-by-side comparison shelf | Constant lowest-price competition on the same screen |
| Branding freedom | Full control over the product page and entire experience | Constrained by platform templates |
| Policy risk | Low — you run it yourself | Subject to changes in fee, algorithm, and settlement policy |
The recommended direction by business stage is as follows.
| Stage | Situation | Recommended platform mix | Goal at this stage |
|---|---|---|---|
| Validation | Product–market fit uncertain, no reviews yet | Marketplace-focused — use platform traffic to test demand | Sales data, initial reviews |
| Growth | Repeat-purchase signals confirmed, ad efficiency proven | Grow owned-store share while running marketplaces in parallel | Build customer data, get the CRM loop running |
| Scale | Repeat-purchase base stable, expanding categories | Owned store as the main channel — marketplace as a supplementary touchpoint | Maximize LTV, spread platform-dependency risk |
The core logic is simple. In the validation stage (few orders per month, product–market fit uncertain), borrow marketplace traffic to validate demand and build up early reviews. Once you hit the growth stage, deliberately grow your owned-store share. The reason connects directly to the previous section: pulling the repeat-purchase and LTV levers requires owning customer data, and marketplaces don’t hand that over. A business where marketplaces account for more than 90% of revenue effectively has its repeat-purchase lever sealed off, and its bottom line sways with a single change to the platform’s fee or algorithm policy. It’s worth building early mechanisms — free-gift cards, membership perks — that convert customers you meet on marketplaces into your own store’s members.
Whatever the platform, the underlying assumption is mobile. As shown earlier, since 78.2% of online shopping transactions happen on mobile, product pages, checkout, and CRM messages should all be designed mobile-first.
Ad Management Principles — Don’t Make ROAS Your Only Goal
The most dangerous habit in ecommerce advertising is making every decision based on ROAS (return on ad spend) alone. ROAS only shows revenue relative to cost — it doesn’t capture margin, incrementality, or future value. Here are three principles for managing ads well.
First, Calculate Your Break-Even ROAS
The right ROAS isn’t an industry average — it comes from your own contribution margin. The formula is simple: Break-even ROAS = 1 ÷ contribution margin rate. Operate without knowing this line, going by the conventional wisdom that “300% ROAS is doing well,” and you’ll keep buying more of what looks like profit on thin-margin products while actually losing money.
| Contribution margin rate | Break-even ROAS | Interpretation |
|---|---|---|
| 20% | 500% | Even 400% ROAS is a loss — the more you sell via ads, the more you lose |
| 30% | ~333% | 350% ROAS is barely profitable |
| 40% | 250% | 300% ROAS starts to be meaningfully profitable |
| 50% | 200% | Room for aggressive new-customer acquisition |
Going a step further, a higher ROAS isn’t always better. If you narrow your targeting to people who were going to buy anyway — retargeting and branded search — ROAS looks beautiful, but new-customer flow dries up and growth stalls. Conversely, an expansion campaign aimed at new customers may show a low ROAS while still being a worthwhile investment once you add in LTV. So don’t lump every campaign under one ROAS target — apply different standards by role. Judge new-acquisition campaigns by ‘first-purchase economics + expected LTV,’ and evaluate retargeting/CRM campaigns conservatively, questioning how much of their credit is truly incremental. We cover the mindset around budget thresholds and marginal ROAS in more depth in The ROI and ROAS Trap.
Second, Feed Automated Campaigns Signal and Creative
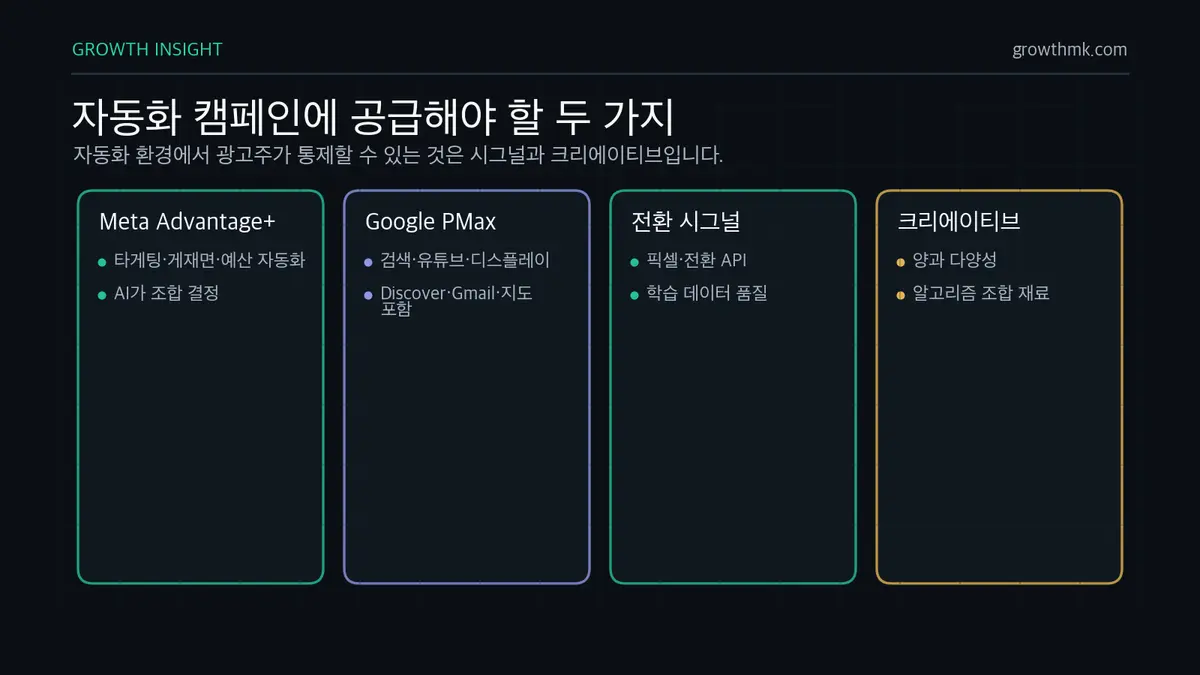
The center of gravity in ad operations has already shifted from manual targeting to machine-learning automation. Meta’s Advantage+ shopping campaigns (formerly Advantage+ Shopping Campaigns/ASC) let AI decide targeting, placement, and budget allocation, and Google’s Performance Max reaches Search, YouTube, Display, Discover, Gmail, and Maps inventory from a single campaign. In this environment, there are only two things an advertiser can really control: the quality of the conversion data (signals like pixel and Conversion API) that the machine learning trains on, and the volume and diversity of the creative the algorithm has to work with. The time you spend supplying these two things determines performance far more than time spent fiddling with account structure. You can find the structure and hands-on setup of ASC in our Meta ASC campaign guide.
Feeding creative requires an operating rhythm. Even a top-performing creative loses steam once creative fatigue sets in from repeated exposure to the same audience, so you need a system that monitors frequency and efficiency trends on your top performers while constantly queuing up rotation candidates for testing. Here too, the standard should be data, not taste. Testing across appeal types — reviews/UGC, problem-framing, spec-comparison — also reveals which message is answering your customers’ exploration-stage questions.
Third, Don’t Trust the Sum of Channel Reports — Look at Incrementality
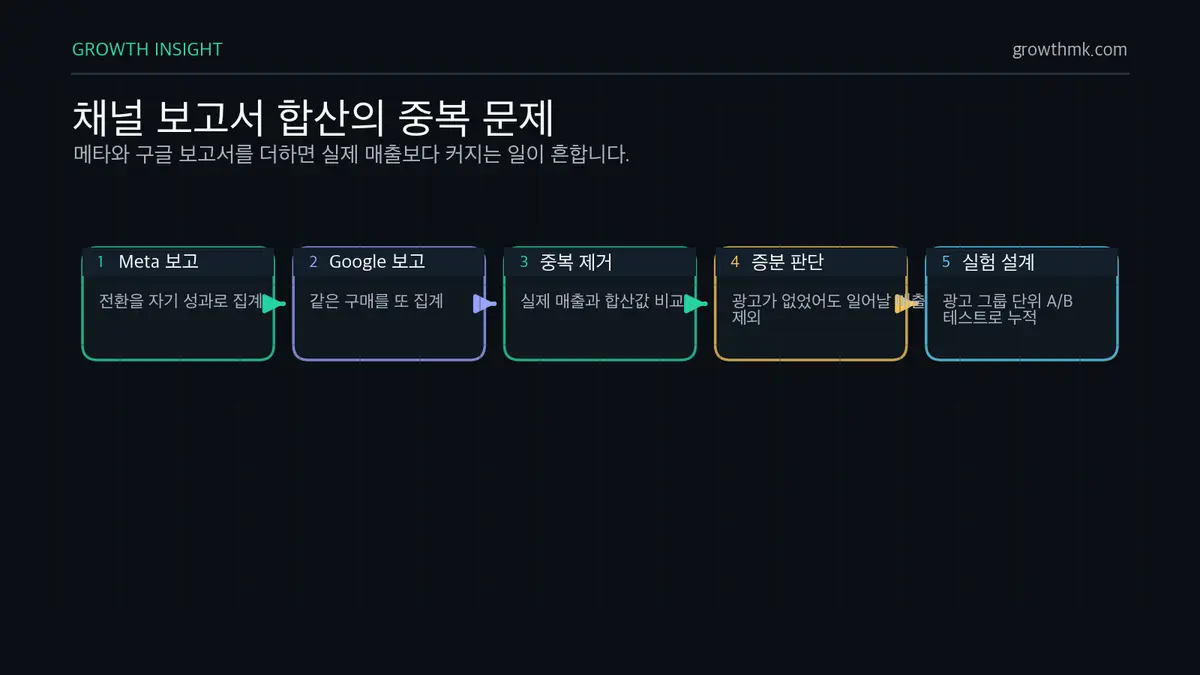
It’s common for the sum of Meta’s and Google’s conversion reports to add up to more than actual revenue, because both platforms count the same purchase as their own result. We cover the incrementality lens — filtering out attribution duplication and subtracting “revenue that would have happened without this ad” — along with experimental designs for verifying channel-level performance, in our complete guide to performance marketing. The standard way to accumulate ad-group-level improvements is through A/B testing, not intuition.
The 7 Most Common Failures in Ecommerce Marketing
Finally, here are the failure patterns we see repeatedly during diagnosis. Compare them against your own situation.
| Failure pattern | Typical symptom | Fix |
|---|---|---|
| 1. Increasing ad spend without diagnosis | Budget keeps growing with no idea why revenue is stalled | Measure the 4 growth-formula levers → fix the bottleneck lever first |
| 2. Running on ROAS alone | ROAS looks good, but the bank balance keeps shrinking | Set a break-even ROAS baseline (1 ÷ contribution margin rate) |
| 3. New-traffic addiction | Revenue crashes the moment ads stop | Design a 30-day post-first-purchase onboarding/CRM loop |
| 4. Ignoring cart abandonment | Lots of cart adds, few checkouts | Abandonment reminders, guest checkout, upfront cost disclosure |
| 5. Blast CRM to everyone | Same message to every customer — rising unsubscribes | Split scenarios by RFM segment |
| 6. Marketplace dependence | 90% of revenue from marketplaces — no customer data | Owned-store conversion mechanisms, channel-mix targets |
| 7. Discount addiction | Revenue only during promotions, full-price sales disappear | Differentiate on value, not price — reviews, content, membership |
All seven share one common thread: the habit of trying to solve problems with spending instead of structure. The essence of ecommerce marketing strategy isn’t the skill of buying ads well — it’s building a structure where the customers who come in accumulate into revenue, and revenue accumulates into repeat purchase.
If you’ve increased ad spend but profit hasn’t grown, the first step is finding out, with data, which lever is your bottleneck. Growth, our marketing agency, offers a performance marketing service that takes ownership on a P&L basis, from growth-formula diagnosis through ad operations and CRM design. If you’d like to know where your store’s bottleneck is, send us your current metrics through a consultation request.
Execution Guides in This Cluster
- How to Choose an Ecommerce Marketing Agency — Contribution Revenue, Not Just ROAS
- Ecommerce Data Operations in Practice — RFM Segments and Cohort Analysis
Frequently Asked Questions (FAQ)
Where should ecommerce marketing start?
Start with diagnosis, not ads. Using the last 3–6 months of data, measure the current values of the four levers — traffic, conversion rate, AOV, and repeat-purchase rate — pick the single weakest lever, and concentrate budget and experiments there. Because the four levers are connected by multiplication, fixing one bottleneck moves total revenue the fastest.
How should I allocate an online store’s marketing budget?
There’s no single fixed ratio, but there is a principle: allocate to new-acquisition ads within the range above your break-even ROAS (1 ÷ contribution margin rate); once you start accumulating repeat-purchase-eligible customers, invest in CRM and membership; and consistently invest a portion in asset-type channels — like search content and reviews — that keep working even when you’re not actively spending. Putting 100% of budget into new-acquisition ads locks in a structure where revenue stops the moment ads stop.
What’s a reasonable ROAS for ecommerce advertising?
It should be calculated from your own contribution margin rate, not an industry average. Break-even ROAS equals 1 divided by your contribution margin rate — at a 30% contribution margin, roughly 333% ROAS is your breakeven point. Add your target profit margin on top of that to set a target ROAS, but manage it alongside your new-customer share, since chasing ROAS purely through retargeting shrinks new-customer flow and stalls growth.
Should I focus on my own store or an open marketplace first?
Early on, it’s efficient to use marketplace traffic to validate demand and build up reviews. But because marketplaces don’t hand over customer data — making repeat-purchase and LTV design difficult — you should deliberately grow your owned-store share once you reach the growth stage. It’s not an either/or choice, it’s a question of designing the mix by stage.
Do small stores with few customers still need RFM and cohort analysis?
Yes. Even with only a few hundred to a thousand cumulative customers, order data alone (order date, customer ID, amount) is enough to build RFM tiers and a monthly cohort table in a spreadsheet. The smaller you are, the more costly every wasted dollar of ad spend is — which makes deciding, with data, who to message and who not to message even more important.