
The ROAS Trap: How a High ROAS Can Still Mean You’re Losing Money
 임재복
임재복
The belief that a high ROAS is a good thing is only half true. That’s because ROAS is nothing more than ‘ad revenue ÷ ad spend’ — it doesn’t account for margin, incrementality, LTV, or true contribution. In a business with a 20% margin, a 300% ROAS looks profitable, but the break-even ROAS is actually 500% (=1÷0.2) — meaning that campaign is losing money. In other words, the same 300% can mean a profit for one business and a loss for another, depending on margin. To connect ads to real revenue, ROAS has to be re-read through a ‘margin-adjusted contribution profit’ lens — using POAS, MER, and incrementality testing. This article walks through that shift, in numbers.
The marketing agency Growth works from one principle: “one customer who will actually buy beats a pile of traffic.” The same logic applies to ROAS. The number that matters isn’t the hundreds-of-percent figure on a dashboard — it’s the profit that ad actually left in the company’s bank account. Below, we’ll walk through what ROAS structurally hides (four things), how the same ROAS can lead to opposite outcomes (a break-even ROAS table), and what to switch to instead (POAS, MER, contribution profit).
How are ROI and ROAS different?
The one thing that separates these two metrics is “how far you count costs.” ROAS (Return On Ad Spend) puts only ‘ad spend’ in the denominator. ROI (Return On Investment) puts every cost the business incurs into the denominator — not just ad spend, but product cost, labor, rent, payment fees, and logistics. So ROAS asks “is this ad channel efficient?” while ROI asks “is this business making money?” They look similar, but they measure different things.
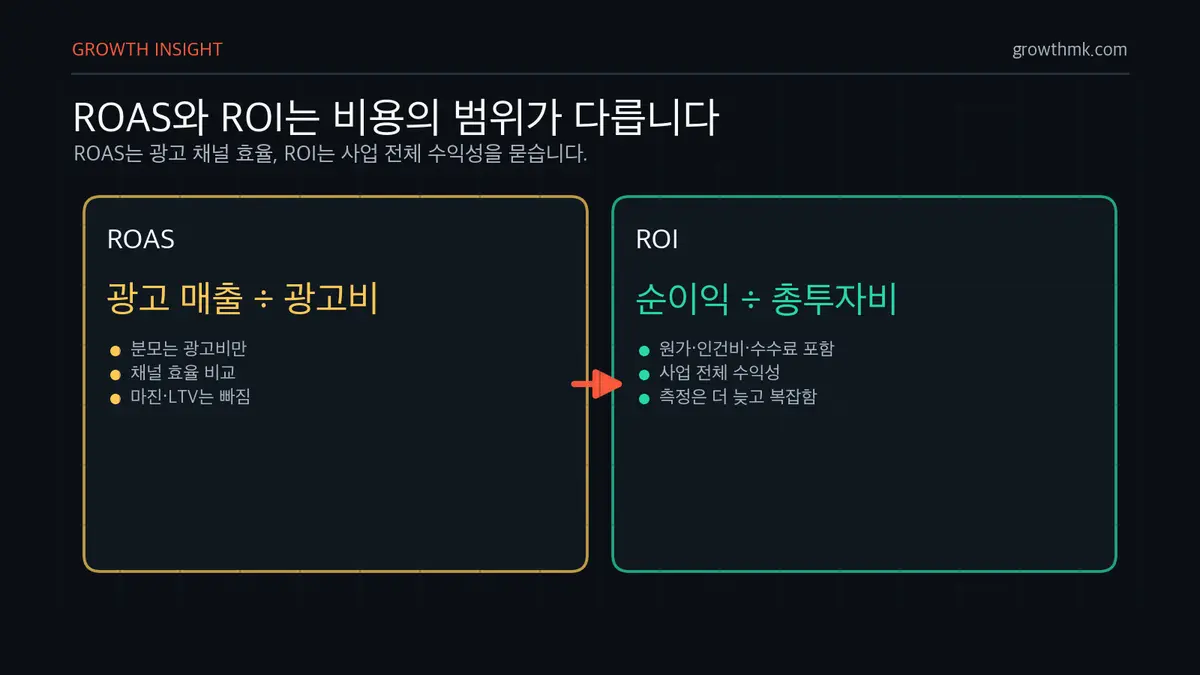
| Category | ROAS (Return On Ad Spend) | ROI (Return On Investment) |
|---|---|---|
| Formula | Ad revenue ÷ ad spend × 100 | (Net profit ÷ total investment) × 100 |
| Denominator (cost) | Ad spend only | Everything — cost of goods, labor, rent, fees, etc. |
| What it measures | Efficiency of an ad channel | Profitability of the whole business |
| What 200% means | Ad spend 1, revenue 2 (profit unknown) | Investment 1, net profit 1 (confirmed gain) |
| Limitation | Ignores margin, incrementality, LTV | Can’t diagnose by channel, measured with a lag |
This is where the first trap shows up. A 300% ROAS means “revenue equal to 3x ad spend,” not “profit equal to 3x ad spend.” ROAS alone can’t tell you how much of that KRW 300 million in revenue the company actually got to keep. This is exactly the point: “even a 300% ROAS can come with an ROI under 100% — in other words, a loss.” ROAS speaks the language of revenue; what we need to know is the language of profit.
Four things ROAS hides
This isn’t to say ROAS is a bad metric — it’s genuinely useful for quickly comparing channels. The problem is making decisions based on ROAS alone. Both the numerator (ad revenue) and denominator (ad spend) of ROAS are missing four pieces of information that actually determine the business’s bottom line. Let’s look at each one, with numbers.

One thing worth noting first: ROAS is beloved not because it’s accurate, but because it’s convenient. Ad platforms display it right on the dashboard, it takes a couple of clicks to compare across channels, and it makes for a bragging-rights number like “300%.” For agencies too, reporting a single ROAS line is far simpler than calculating and explaining margin, incrementality, and LTV. A metric that becomes a KPI because it’s easy to measure ends up distorting decisions for that very same reason. The trap of ROAS isn’t really in ROAS itself — it’s in the habit of looking at ROAS alone.
1. It ignores margin — revenue is not profit
ROAS only counts revenue. But profit only appears once you subtract cost from that revenue. Two companies can post the same 400% ROAS and end up with opposite results if their margins differ. Let’s compare two companies that both turned KRW 10 million in ad spend into KRW 40 million in revenue (400% ROAS).
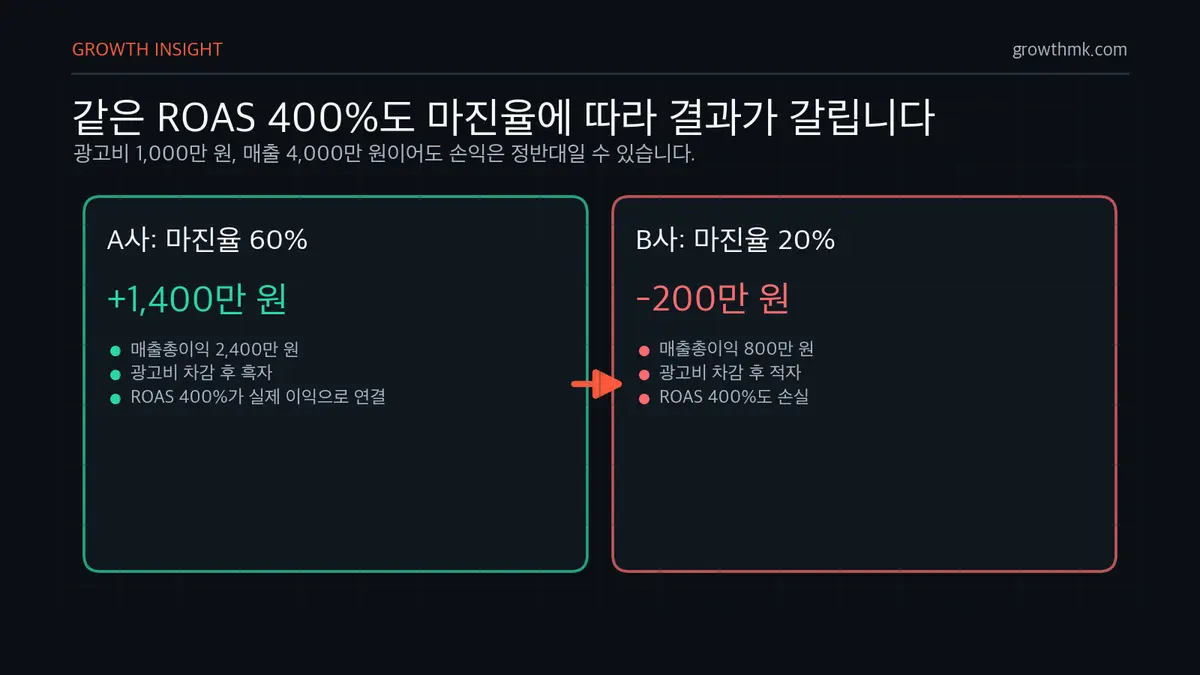
| Item | Company A (60% margin) | Company B (20% margin) |
|---|---|---|
| Ad spend | KRW 10 million | KRW 10 million |
| Ad revenue | KRW 40 million | KRW 40 million |
| ROAS | 400% | 400% |
| Gross profit (revenue × margin) | KRW 24 million | KRW 8 million |
| Contribution profit after ad spend | +KRW 14 million (profit) | −KRW 2 million (loss) |
Same 400% ROAS — yet Company A earns KRW 14 million while Company B loses KRW 2 million. On a ROAS dashboard, both look like equally “successful campaigns.” ROAS without margin can’t tell profit from loss. (The figures above assume specific margin rates for illustration; the formulas are laid out in the table.)
2. It ignores incrementality — ‘revenue the ad created’ vs. ‘revenue that would have happened anyway’
The number ROAS calls “revenue driven by ads” includes revenue that would have happened even without the ad. A customer who already knew the brand and searched for it, or a loyal repeat buyer who happened to click an ad on their way to a purchase they were already going to make — that entire sale still gets credited to the ad. What actually matters is incremental revenue — the revenue that would not have happened without that ad.
Google offers Conversion Lift as a way to measure this. It splits users into a group that saw the ad and a group that didn’t, and treats the difference in conversions between the two groups as the “incremental conversions the ad caused” (Google Ads Help, About Conversion Lift). Google calls this kind of incrementality testing “the industry’s gold standard for understanding advertising’s true impact in a privacy-first era,” and cites cases where one beauty brand saw a 600% incremental ROAS on Performance Max, while a financial company found YouTube’s incremental contribution was only 10% (Think with Google, Incrementality testing).
| Item | Reported ROAS | After incrementality testing |
|---|---|---|
| Ad spend | KRW 10 million | KRW 10 million |
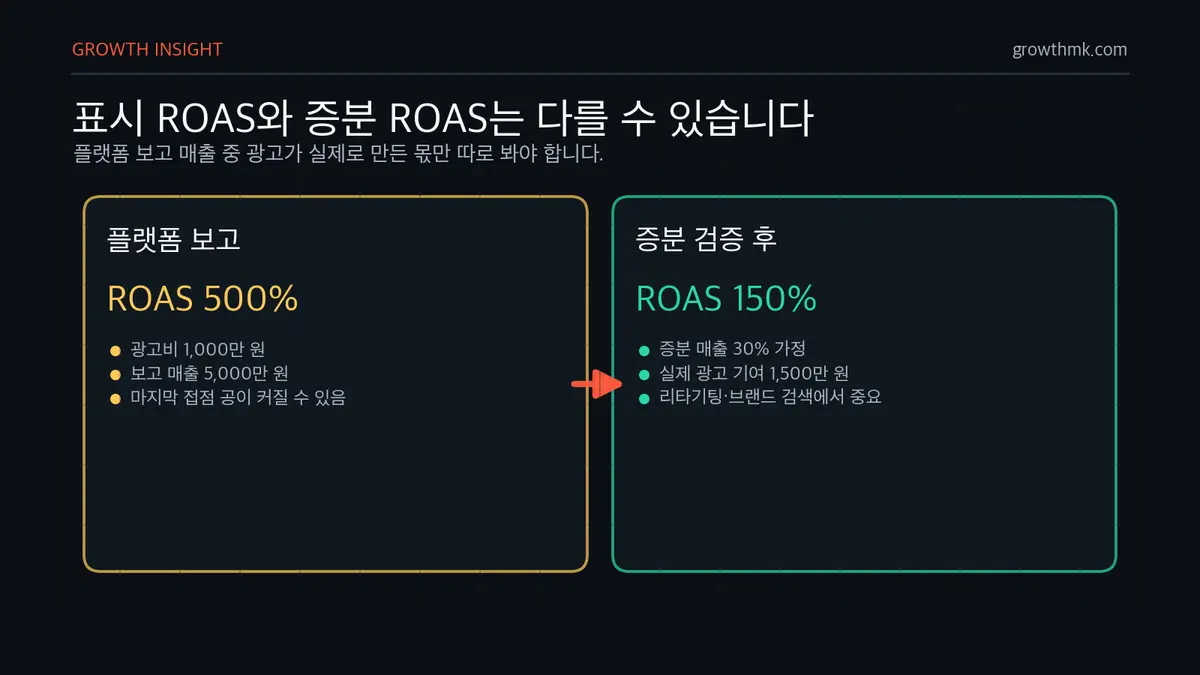
| Revenue reported by the platform | KRW 50 million | KRW 50 million |
| Of which, incremental revenue (e.g. 30%) | — | KRW 15 million |
| Metric | Reported ROAS 500% | Incremental ROAS 150% |
A reported ROAS of 500% says “ads earned 5x,” but if only 30% of that is incremental, ads actually created 1.5x. Retargeting and branded search ads fall into this trap especially often, since they show ads to people who were already going to buy, then claim credit for that revenue. (The 30% incrementality rate is something you determine through testing; the figures above are illustrative.)
3. It ignores LTV — the short-sightedness of counting only the first purchase
Most ROAS calculations count only the ‘first purchase’ that happens within a few days of a click. But a business’s true value lies in the cumulative revenue a customer generates over their entire relationship with the brand — in other words, customer lifetime value (LTV). Looking only at first-purchase ROAS makes businesses with frequent repeat purchases under-invest in ads, and one-off-purchase businesses over-invest.
| Item | First purchase only | LTV basis (annual) |
|---|---|---|
| Customer acquisition cost (CAC) | KRW 50,000 | KRW 50,000 |
| First-purchase revenue | KRW 50,000 | KRW 50,000 |
| Annual revenue including repeat purchases | — | KRW 200,000 (4 purchases) |
| ROAS | 100% (looks break-even) | 400% (true value) |
If you look only at a first-purchase ROAS of 100% and decide “we’re just breaking even, so let’s cut ad spend,” you’re choking off customers who would have generated 4x their lifetime value. Conversely, if a business has almost no repeat purchases, first-purchase ROAS really is close to the whole story, so it should be judged more conservatively. Viewing customers as a journey rather than a single transaction is covered in more depth in our piece on the customer decision journey (CDJ).
4. It relies on attribution — the last click takes all the credit
Which channel gets credit for the ‘revenue’ in ROAS is decided by an attribution model. For a long time, the default was ‘last-click’ attribution, which hands 100% of the revenue to the single click right before conversion. Everything that built awareness before that — content, video, display — gets zero credit. HBR points out that “TV ads drive search, that search leads to a display click, which eventually leads to a purchase,” yet a last-click model attributes the entire chain to that one final click. One electronics company simply reallocated its budget to properly reflect how channels interact with each other, and reported that it “boosted revenue by 9% without spending a single additional dollar on ads” (Harvard Business Review, Advertising Analytics 2.0).
That’s why Google, in 2023, retired last-click as the default in GA4 and switched to machine-learning-based data-driven attribution instead. Attribution is “the act of assigning credit to the various ads, clicks, and factors along the path to a conversion,” and a data-driven model, “rather than giving all the credit to the last touchpoint, calculates each touchpoint’s real contribution from account data” (Google Analytics Help, Attribution models). Here’s the key point — the ROAS of the exact same channel can change entirely depending on which model you use. ROAS isn’t an objective truth; it’s the product of a measurement rule. Why measurement design itself is the foundation of good decisions is covered in why your tracking setup matters.
Same ROAS, different fate — the break-even ROAS table
Of the four traps, margin (#1) is the one you can put to use immediately. There’s a single line that separates a profitable ROAS from a losing one: break-even ROAS. And the formula is remarkably simple.
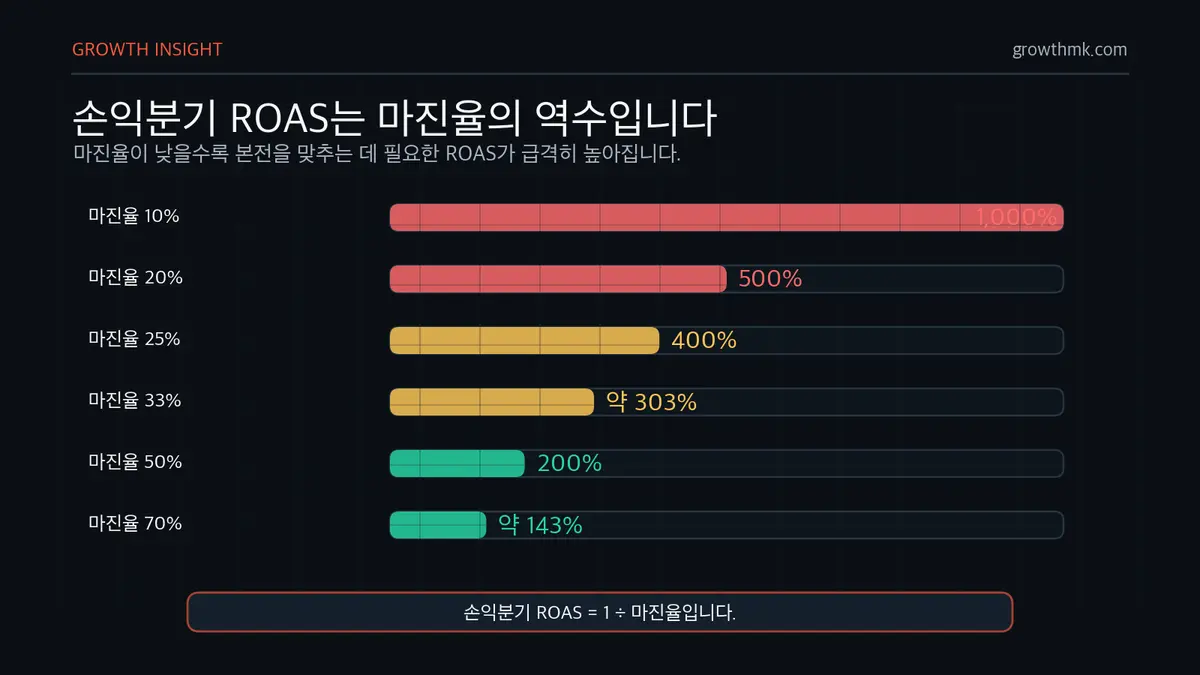
- Break-even ROAS = 1 ÷ margin rate (as a percentage: 1 ÷ margin rate × 100%)
- Derivation: you break even when ad revenue × margin rate = ad spend. Divide both sides by ad spend, and you get ROAS × margin rate = 1, so ROAS = 1 ÷ margin rate.
This one line is what finally turns ROAS into the language of profit and loss. The lower the margin, the steeper the ROAS you need just to break even. Here’s how it breaks down by margin rate.
| Margin rate | Break-even ROAS (=1÷margin rate) | What does a 300% ROAS mean at this margin? |
|---|---|---|
| 10% | 1,000% | Deep loss (−) |
| 20% | 500% | Loss (−) |
| 25% | 400% | Loss (−) |
| 33% | ~303% | Roughly break-even (±0) |
| 50% | 200% | Profit (+) |
| 70% | ~143% | Strong profit (+) |
The table points to one conclusion: there’s no such thing as a universally “good” ROAS. For a business with a 70% margin, a 143% ROAS is break-even and anything above that is pure profit — yet for a business with a 20% margin, a 400% ROAS is still a loss. When an agency reports “we hit 300% ROAS!”, the first question to ask is “what’s our break-even ROAS?” Without that baseline, there’s no way to tell whether 300% is something to celebrate or a warning sign.
Adding one more insight completes the picture. If you’re ‘above’ break-even ROAS — meaning every additional sale leaves a profit — the right move is to keep scaling ad spend up to the point of diminishing returns. Even if the profit per sale looks small, as long as it’s positive, scaling up grows total profit. Conversely, cutting budget “to boost ROAS” while you’re above break-even means throwing away profit you could have kept earning. The point where market saturation drags incremental efficiency below break-even is what we at Growth call the ‘ad budget ceiling.’ The order of operations is: first set break-even ROAS as your baseline → scale spend up to the ceiling while above it → only then work on efficiency (creative, channel, targeting) once you’ve hit the ceiling.
A real consultation — “ROAS is only 125%, so we’re cutting the budget”
This is a scene Growth runs into often. A client tells us, “our current ad ROAS is only 125%,” and wants to cut the budget. The reality: KRW 80 million in ad spend generating KRW 100 million in revenue (125% ROAS), leaving a KRW 20 million surplus after ad costs. Even under the simplifying assumption that revenue equals contributable profit, this campaign is generating a KRW 20 million surplus every month. Saying “ROAS is low, so let’s cut it” overlooks the question of where that KRW 20 million is actually coming from.
The real question is just this: “if we cut the budget, does the profit we’re currently keeping go up or down?” Even if cutting spend improves the ROAS ratio, if the revenue the ads were generating — and the contribution profit that revenue left behind — disappears along with it, the company’s total profit shrinks. The ROAS ‘ratio’ improves while the ‘absolute amount’ left in the bank account gets smaller. So the two questions we ask before ROAS are: (1) is this ad, above break-even ROAS, generating positive contribution profit per sale, and (2) have we already hit the ad budget ceiling? If we’re below the ceiling and contribution profit is positive, the answer isn’t to cut the budget — it’s to increase it.
This is absolutely not to say ROAS doesn’t matter — improving it is ongoing work that should never stop. But the moment you try to achieve that improvement by cutting the budget, you’ve gotten the priorities backwards. What’s more, the smaller the ad budget, the smaller the sample size, meaning ROAS can swing from 2,000% to 0% depending on just one or two customers who happened to buy. A flashy ROAS from a tiny budget is often sampling error, not skill. A stable ROAS only means something once you have enough scale — which is exactly what “one customer who will actually buy beats a pile of traffic” really means: you still need to gather that ‘one customer’ in numbers large enough to trust statistically.
So what should you look at instead? — POAS, MER, and contribution profit
This isn’t about throwing ROAS out. It’s about stacking layers of profit-and-loss thinking ‘on top of’ ROAS. We recommend a metrics framework that moves step by step — from a revenue lens to a profit lens, from channel-level to company-wide, and from reported figures to incremental figures.

| Metric | Formula | What it fixes |
|---|---|---|
| ROAS | Ad revenue ÷ ad spend | Channel comparison (starting point) |
| POAS (Profit On Ad Spend) |
Profit driven by ads ÷ ad spend | Fixes #1 (margin) — profit basis instead of revenue |
| MER (Marketing Efficiency Ratio) |
Total revenue ÷ total marketing spend | Fixes #4 (attribution dependence) — combined, company-wide efficiency |
| Contribution profit | (Incremental revenue × margin) − ad spend | Fixes #2 (incrementality) + #1 (margin) — ‘what the ad actually left behind’ |
| LTV:CAC | Customer lifetime value ÷ customer acquisition cost | Fixes #3 (LTV) — a long-term payback lens |
POAS swaps ROAS’s numerator from ‘revenue’ to ‘profit,’ solving the margin trap head-on. MER looks at “total revenue against total marketing spend this month” without splitting by channel — a company-wide metric where even a distorted attribution model can’t warp overall efficiency. Contribution profit — incremental revenue times margin, minus ad spend — is the single line closest to the truth: the actual money the ad left in the company.
We recommend rolling this out in stages. Rather than trying to measure everything perfectly from day one and getting stuck, it’s more realistic to climb the ladder one step at a time.
- Step 1 — Compare with ROAS: Quickly compare channels and campaigns on the same scale. (Just don’t use it as an absolute benchmark.)
- Step 2 — Add margin (POAS, break-even ROAS): Plug in margin rates by product or category to draw a profit/loss line. This step alone filters out most bad budget decisions.
- Step 3 — Verify incrementality (incremental ROAS, contribution profit): Use conversion lift experiments or geo-based tests to answer “what if this ad didn’t exist?” Google has lowered the experiment budget threshold needed for this, making it accessible even to smaller advertisers (Think with Google).
- Step 4 — Long-term payback (LTV:CAC): For businesses with repeat purchases or subscriptions, connect the numbers all the way to lifetime value to re-evaluate how much ad investment you can afford.
How to weave this framework into ad operations end-to-end is covered comprehensively — platforms, attribution, and how to recover from underperformance — in Growth’s complete guide to performance marketing. It’s also worth reading alongside CPC (cost per click), ROAS’s natural counterpart, to get a fuller read on the denominator of ‘efficiency.’
A practical transition guide — what to demand in your agency’s reports
The fastest way to change your perspective is to change the format of the reports you receive. If you’re getting a one-line ROAS report, ask for the following instead. Whether an agency can actually fill out this table is a good litmus test for whether it thinks in terms of revenue.
| Requested item | Why it matters | The risk of not having it |
|---|---|---|
| Margin rate by product/category and break-even ROAS | Establishes a profit/loss baseline | You can’t interpret what the ROAS number means |
| POAS or contribution profit (profit, not revenue) | Evaluation based on what’s actually left over | A losing campaign gets mistaken for a success |
| Which attribution model is applied | Transparency in how ROAS is calculated | ROAS gets dressed up by switching models |
| Incrementality testing plan/results (where possible) | Isolates ‘the ad’s real effect’ | Revenue from already-committed buyers gets credited to ads |
| Overall MER (all channels combined) | Company-wide efficiency, unaffected by channel distortion | The sum of per-channel ROAS doesn’t match reality |
| Estimated daily/weekly/monthly ad budget ceiling | Tells you when there’s room to spend more vs. time to optimize | Cutting budget prematurely, before hitting the ceiling |
You don’t need every item from month one. Just clarifying three things — margin rate, break-even ROAS, and the attribution model in use — resolves most of the mystery behind “ROAS is high, so why isn’t the company keeping any of it?” If a report can’t answer these three in even one sentence, that ROAS number is closer to raw, uninterpreted data than a basis for trust.
The broader mindset of connecting metrics to revenue also ties into the hypothesize–measure–learn loop behind growth hacking (definition, AARRR, experiment design). And which changes actually moved contribution profit — rather than just ROAS — can be verified through continuous improvement via A/B testing.
Growth designs and runs ad campaigns based on ‘contribution profit’ — reflecting margin, incrementality, and lifetime value — not a single ROAS line. We prove results with the money an ad actually left in the bank, not a hundreds-of-percent number on a screen. Start by checking your own break-even ROAS and ad budget ceiling with us. Take a look at Growth’s performance marketing service, or get in touch to have your current reporting diagnosed.
Frequently asked questions (FAQ)
Why is my company losing money when ROAS is high?
Because ROAS is ‘ad revenue ÷ ad spend’ — it counts only revenue and doesn’t reflect margin. If you’re below break-even ROAS (=1÷margin rate), even a high-looking ROAS is actually a loss. For example, with a 20% margin, break-even ROAS is 500%, so a 400% ROAS looks profitable but is really a loss. Factor in ROI — which adds labor, rent, and other non-ad costs — and the loss can be even larger. You need to look at profit-based metrics (POAS, contribution profit), not revenue, to see the real bottom line.
How do you calculate break-even ROAS?
The formula is break-even ROAS = 1 ÷ margin rate. At a 50% margin, 1÷0.5 = 2.0, so 200% ROAS is the break-even line. At a 25% margin, 1÷0.25 = 4.0, so 400% ROAS is break-even. The lower the margin, the steeper the ROAS needed just to break even. You need this baseline before you can judge what counts as “a good ROAS” for your business. It’s derived by dividing both sides of ‘ad revenue × margin rate = ad spend’ by ad spend.
Is it okay to cut ad budget just to boost ROAS?
If you’re above break-even ROAS, it’s usually better not to cut. In the range where every sale generates a profit, cutting the budget improves the ROAS number but shrinks total profit at the same time. The right sequence is to keep scaling budget up to the ‘ad budget ceiling’ — the point where incremental efficiency drops below break-even — and only then start improving efficiency (ROAS) through creative, channel, and targeting work. Cutting budget purely to chase a better ROAS is a common but expensive mistake.
How is incremental ROAS different from regular ROAS?
Regular ROAS counts all the revenue a platform attributes to an ad. Incremental ROAS counts only ‘the revenue that would not have happened without the ad,’ measured through conversion lift experiments that compare a group that saw the ad against a group that didn’t (Google Ads Help). Retargeting and branded search ads shown to people who were already going to buy often show a high reported ROAS but a low incremental ROAS. When deciding whether to increase budget, you should look at the incremental figure, not the reported one.