
Korea SaaS Market Statistics — Size, Growth, Investment, and Adoption Trends (Sourced)
 임재복
임재복Korea’s domestic cloud market generated ₩9.26 trillion in revenue in 2024, and within that, the Software-as-a-Service (SaaS) segment came in at ₩3.22 trillion, up 24.2% year over year (Ministry of Science and ICT / NIPA, 2025 Cloud Industry Survey). Still, SaaS accounts for only about 24% of Korea’s domestic software market, well below the global average of 41% (NIPA). The global SaaS market is estimated at roughly $315.7 billion in 2025, with an 18.7% compound annual growth rate projected (Fortune Business Insights). Korean SaaS is a market that’s “growing fast but still small” — and that gap is itself the size of the growth opportunity.
This article is a data asset that compiles Korea’s SaaS market size, growth rate, investment, and adoption trends into sourced statistics. Every figure is labeled with its source institution and year, and no unverified estimates are included. It’s built table-first so marketers and decision-makers can cite it, plan with it, and use it directly for investment review.
Three key numbers, at a glance
For anyone short on time, here are the three numbers that most compactly capture Korea’s SaaS market. The source and reference year for each are labeled in the table.
| Key metric | Figure | Reference year | Source |
|---|---|---|---|
| Korea SaaS market size (revenue) | ₩3.22 trillion (+24.2% YoY) | 2024 | Ministry of Science and ICT / NIPA, 2025 Cloud Industry Survey |
| SaaS share of Korea’s software market | ~24% (global average: 41%) | 2024 release | NIPA |
| Global SaaS market size | ~$315.7 billion (18.7% CAGR) | 2025 | Fortune Business Insights |
How big is Korea’s SaaS market, and how fast is it growing?
The most reliable primary statistics come from the Cloud Industry Survey published annually by Korea’s Ministry of Science and ICT and the National IT Industry Promotion Agency (NIPA). According to the 2025 survey (released March 2026, covering reference year 2024), Korea’s total cloud sector revenue reached ₩9.26 trillion in 2024, up 25.2% from ₩7.3954 trillion in 2023, with a 5-year CAGR of 23.2% (Digital Today, citing the survey).
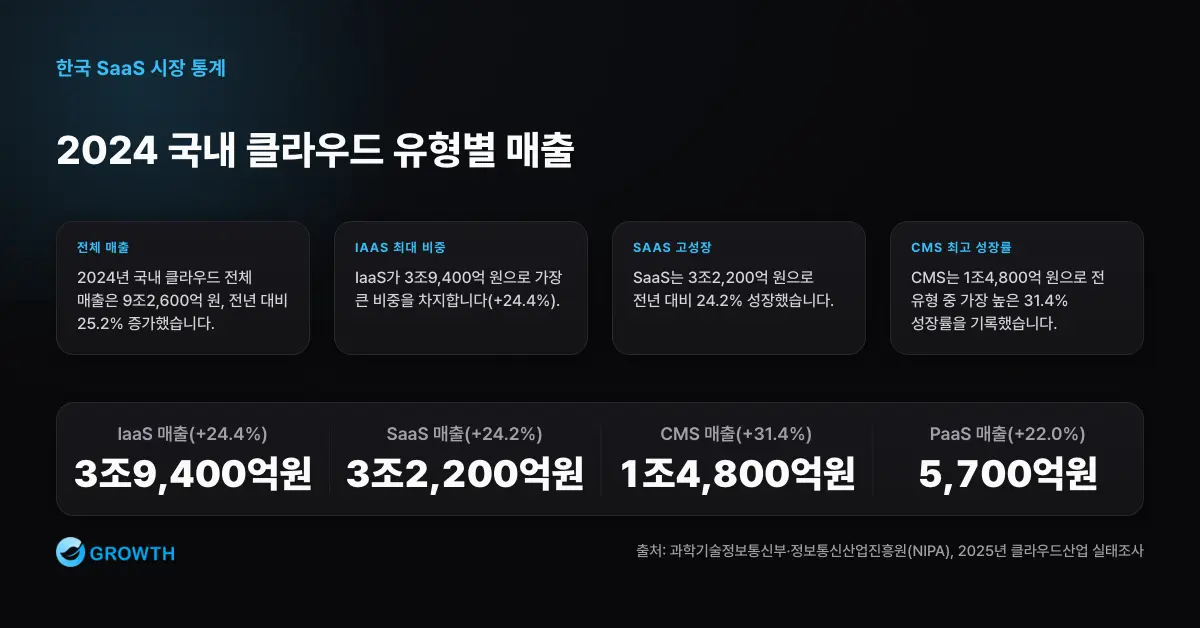
Within that, the SaaS segment hit ₩3.22 trillion in 2024, up 24.2% from ₩2.59 trillion in 2023. Broken down by service type, IaaS is the largest, with SaaS close behind. The table below shows revenue by type from the same survey.
| Cloud type | 2023 revenue | 2024 revenue | Growth rate | Source |
|---|---|---|---|---|
| IaaS (Infrastructure) | ₩3.1687 trillion | ₩3.94 trillion | +24.4% | Ministry of Science and ICT / NIPA, 2025 Cloud Industry Survey |
| SaaS (Software) | ₩2.59 trillion | ₩3.22 trillion | +24.2% | Ministry of Science and ICT / NIPA, 2025 Cloud Industry Survey |
| Managed services (CMS) | ₩1.13 trillion | ₩1.48 trillion | +31.4% | Ministry of Science and ICT / NIPA, 2025 Cloud Industry Survey |
| PaaS (Platform) | ₩470 billion | ₩570 billion | +22.0% | Ministry of Science and ICT / NIPA, 2025 Cloud Industry Survey |
| Total cloud market | ₩7.3954 trillion | ₩9.26 trillion | +25.2% | Ministry of Science and ICT / NIPA, 2025 Cloud Industry Survey |
Looking at the year-over-year trend, Korea’s SaaS market moved from ₩2.136 trillion in 2022, to ₩2.59 trillion in 2023, to ₩3.22 trillion in 2024 — three straight years of double-digit growth. The 2022 figure comes from the 2023 Cloud Industry Survey, while the 2023–2024 figures come from later editions of the same survey (ZDNet, reporting on the 2023 survey).
| Year | Korea SaaS revenue | YoY growth | Source |
|---|---|---|---|
| 2022 | ₩2.136 trillion | — | Ministry of Science and ICT / NIPA, 2023 Cloud Industry Survey |
| 2023 | ₩2.59 trillion | ~+21% | Ministry of Science and ICT / NIPA, 2024 Cloud Industry Survey |
| 2024 | ₩3.22 trillion | +24.2% | Ministry of Science and ICT / NIPA, 2025 Cloud Industry Survey |
Private market research firms project a similar growth trajectory. Korea IDC forecasts that Korea’s public cloud software market (SaaS-centric) will grow from ₩1.7844 trillion in 2023 (+19.9% YoY) to ₩3.0614 trillion by 2026, a 15.5% CAGR over 2022–2026 (Korea IDC forecast, reported by ZDNet). Since the government survey (actual revenue) and IDC (market estimate) use different scopes, their absolute figures differ — so it’s worth specifying which basis you’re citing.
How many SaaS companies are there, and how fast is that number growing?
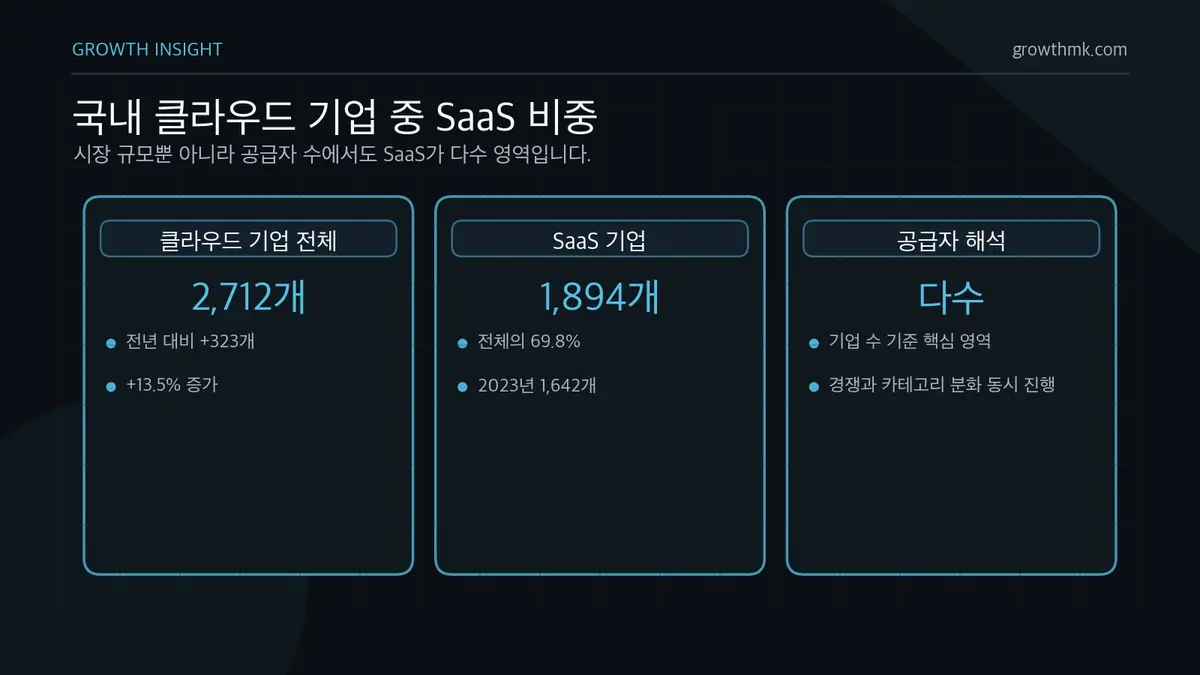
Just as important as market size is the change in the number of suppliers. Per the 2025 Cloud Industry Survey, Korea had a total of 2,712 cloud companies in 2024, up 323 (13.5%) year over year, of which 1,894 were SaaS companies — 69.8% of the total (Electronic Times, reporting on the survey). By company count too, SaaS is where the majority of Korea’s cloud industry players sit.
| Category | Figure | Reference year | Source |
|---|---|---|---|
| Total cloud companies in Korea | 2,712 (+323, +13.5%) | 2024 | Ministry of Science and ICT / NIPA, 2025 Cloud Industry Survey |
| SaaS companies | 1,894 (69.8% of total) | 2024 | Ministry of Science and ICT / NIPA, 2025 Cloud Industry Survey |
| SaaS companies (prior year) | 1,642 (+24% YoY) | 2023 | Ministry of Science and ICT / NIPA, 2024 Cloud Industry Survey |
Investment trends: startup funding is down — but what about SaaS?
Korea’s overall startup investment market has been in a correction phase since peaking in 2022. According to THE VC, Korea’s startup funding database, total investment into Korean startups and SMEs came to ₩6.0863 trillion in 2024, down roughly 20% year over year, across 1,336 deals (Wowtale, citing THE VC data). H1 alone came to ₩2.6461 trillion, down 19.5% from the same period the prior year, showing the pullback held steady across the whole year (THE VC, 2024 Korea Startup Investment Statistics).
| Metric | 2023 | 2024 | Source |
|---|---|---|---|
| Total Korea startup investment | ~₩7 trillion range | ₩6.0863 trillion (~−20%) | THE VC (via Wowtale) |
| Number of deals | ~1,800 range | 1,336 | THE VC |
| H1 investment amount | — | ₩2.6461 trillion (−19.5%) | THE VC |
There’s an important nuance here. The more overall investment contracts, the more capital tends to flow toward businesses that can prove “quality of growth.” SaaS is often cited as a business model investors favor even during a slowdown, thanks to subscription-based recurring revenue and high revenue predictability. The government is directing resources in the same direction: NIPA allocated roughly ₩9 billion for promising SaaS development and support in 2025, ₩4.016 billion for large-scale AI cloud services, and ₩4.6 billion for its Global SaaS (GSIP) program (ZDNet, reporting on NIPA’s support programs). That said, no credible institution separately tracks and publishes an annual investment total for “SaaS only,” so this article presents overall startup investment trends and government support budgets as proxy indicators instead.
Adoption trends: how far has SaaS adoption come among Korean companies?
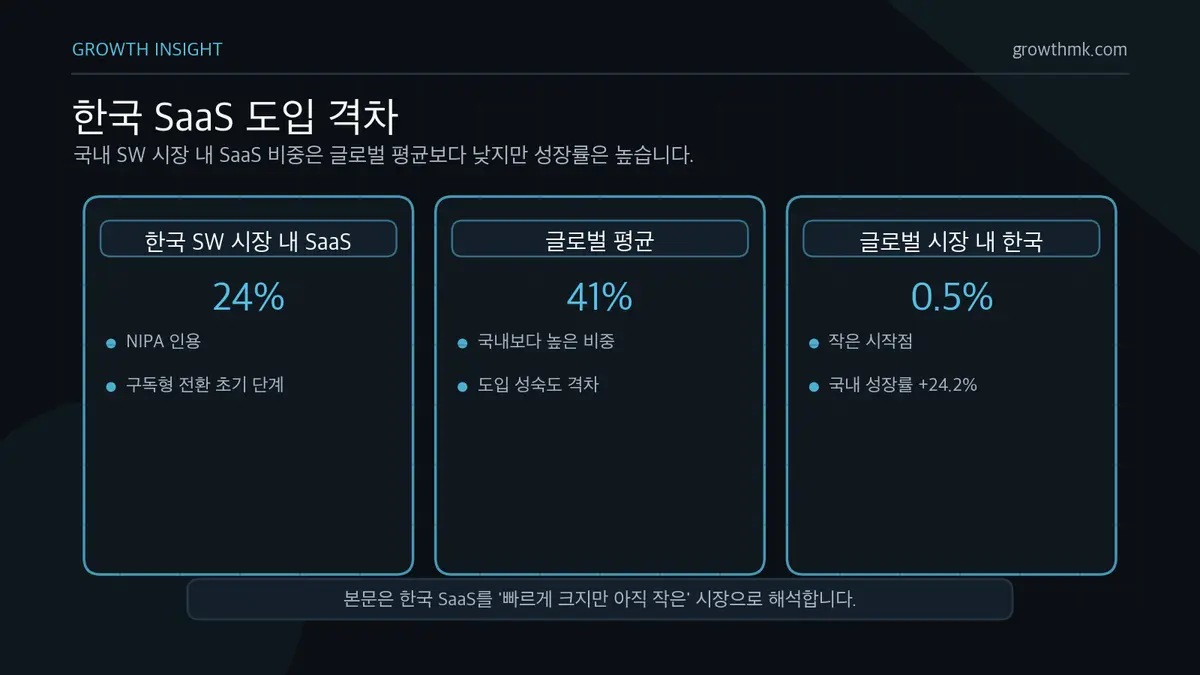
While supply (company count) and market size are growing quickly, demand-side adoption still lags the global average. Per NIPA, SaaS accounts for only about 24% of Korea’s domestic software market — a wide gap from the global average of 41% (ZDNet, citing NIPA). In a market where on-premise software has long been the standard, switching costs and psychological resistance are cited as the main reasons for the gap.
| Adoption metric | Korea | Global / comparison | Source |
|---|---|---|---|
| SaaS share of software market | ~24% | Global average: ~41% | NIPA (via ZDNet) |
| Korea’s share of the global SaaS market | ~0.5% | — | DigitalDaily (converted from Fortune Business Insights’ global figure) |
This gap shows that SaaS adoption in Korea is still at an “early stage” — but that’s also a signal of substantial remaining growth potential, since demand that hasn’t yet shifted from on-premise to subscription still makes up the majority of the market.
Where does Korea stand relative to the rest of the world?
The global SaaS market dwarfs Korea’s by comparison. Fortune Business Insights projects the global SaaS market will grow from roughly $315.7 billion in 2025 to about $1.4824 trillion by 2034, an 18.7% CAGR over the forecast period. The same report estimates the Asia-Pacific market at $69.43 billion in 2025, or 22% of the global total (Fortune Business Insights, SaaS Market Report).
Looking at global estimates from an end-user spending perspective makes the scale even clearer. Gartner projects worldwide public cloud end-user spending will grow from roughly $600 billion in 2024 to $723.4 billion in 2025, up 21.5%, with SaaS application spending within that climbing from just over $250 billion in 2024 to nearly $300 billion in 2025 (CIO Dive, citing Gartner).
| Market | Size | Reference year | Growth outlook | Source |
|---|---|---|---|---|
| Global SaaS market | ~$315.7 billion | 2025 | 18.7% CAGR (to 2034) | Fortune Business Insights |
| Global SaaS spend (applications) | $250B+ → ~$300B | 2024 → 2025 | ~+20% YoY | Gartner (via CIO Dive) |
| APAC SaaS market | $69.43 billion (22% of global) | 2025 | Continued growth | Fortune Business Insights |
| Korea SaaS market | ₩3.22 trillion (roughly $2.3 billion) | 2024 | +24.2% | Ministry of Science and ICT / NIPA, 2025 Cloud Industry Survey |
Korea’s SaaS market accounts for only about 0.5% of the global total, but its growth rate (+24.2% domestically) outpaces the global average (roughly +18–20%). It’s a small starting point that’s catching up faster than the rest of the world.
What this means for marketers
Reading this data through a marketing lens surfaces three practical takeaways. First, the real bottleneck in Korea’s SaaS market isn’t awareness — it’s conversion. SaaS accounting for only 24% of the domestic software market means most potential customers are still sitting on-premise. That means the core job of SaaS marketing isn’t introducing a new category — it’s persuading prospects, at the exact stage of their decision-making, of “why switch to a subscription model now.” Here, precisely reaching the small pool of decision-makers actually evaluating adoption matters far more than chasing vague traffic volume. That’s exactly why the customer decision journey (CDJ) framework we consistently emphasize at Growth fits SaaS so well.
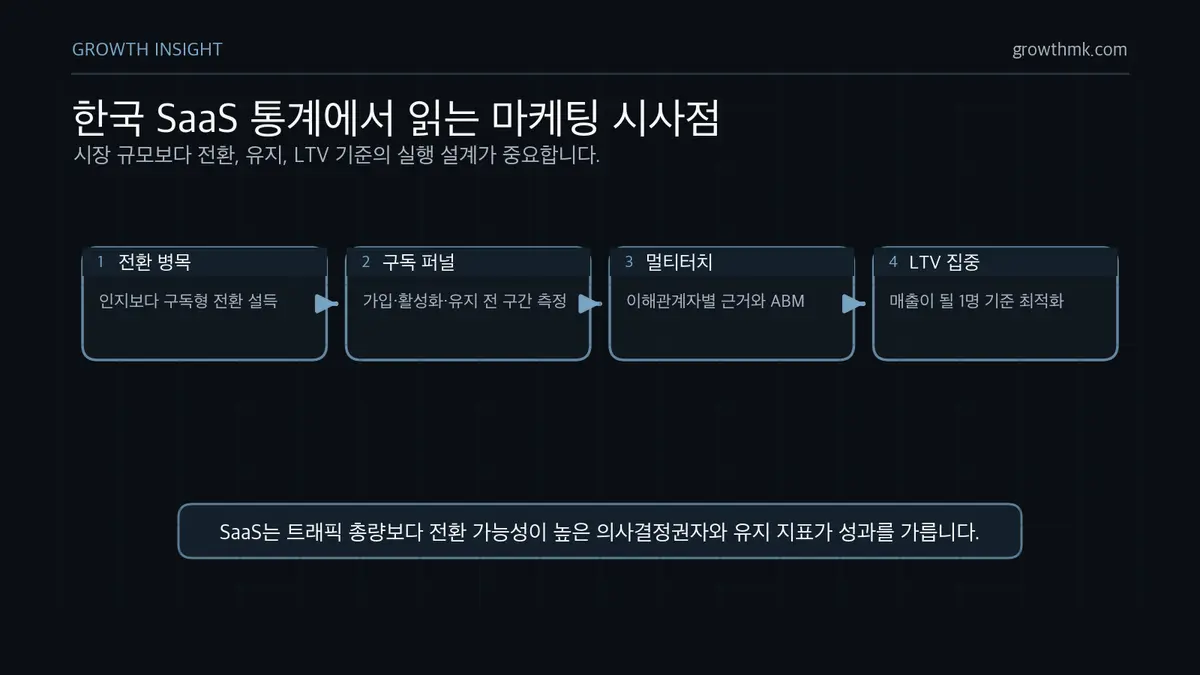
Second, SaaS’s business model itself is optimized for data-driven marketing. In SaaS, where subscription, churn, and expansion are all measurable, results are decided less by a single ad impression than by a growth methodology that tracks every stage from signup through activation and retention, using data. The growth hacking (AARRR) approach, which improves everything from acquisition to referral through experimentation, fits naturally with SaaS’s recurring-revenue structure. And because B2B SaaS purchase decisions involve multiple stakeholders, the multi-touch, ABM-oriented thinking covered in our Complete Guide to B2B Marketing tends to outperform single-channel advertising.
Third, the principle of “the one person who becomes revenue” plays out most clearly of all in SaaS. SaaS unit economics are ultimately determined by a single customer’s lifetime value (LTV). So the goal of marketing shouldn’t be visitor count — it should be bringing in the right-fit customers (ICP) who will actually see adoption through to a decision. Explaining your product precisely in the customer’s own language, and having content ready to answer the questions that come up during evaluation, translates directly into conversion rate. As a foundation for this, we’d recommend checking both content SEO that starts from the customer’s perspective and why proper tracking setup (GA4) matters for making your tool’s credibility measurable throughout the evaluation process.
Data update policy
To keep this page reliable, we update its statistics at least once a year, replacing figures based on the latest releases from primary sources (the Ministry of Science and ICT / NIPA Cloud Industry Survey, Gartner, Fortune Business Insights, IDC, and THE VC). Each table labels its source institution and reference year, so you can distinguish the citation date from the data’s reference date.
- Last verified: June 11, 2026
- Next scheduled update: Upon release of the next Cloud Industry Survey (typically published in Q1 each year)
- Labeling policy: Actual figures (from the government survey) and estimates (from IDC, Gartner, Fortune Business Insights) are clearly distinguished
Related services
Growth designs data-driven content, search, and performance marketing to help SaaS and B2B companies bring in “the one person who becomes revenue,” not just traffic volume. If you’d like to work through market data interpretation, ICP definition, and conversion design together, take a look at Growth’s marketing services, and let us know your specific challenge via consultation inquiry.
You can see the full picture of this topic at a glance in “The Complete Guide to SaaS Marketing — PLG vs. SLG, CAC and LTV, and the Korean Market.”
Frequently asked questions
Exactly how big is Korea’s SaaS market?
Per the Ministry of Science and ICT / NIPA’s 2025 Cloud Industry Survey, Korea’s domestic SaaS segment generated ₩3.22 trillion in revenue in 2024, up 24.2% from ₩2.59 trillion the prior year. Note this is based on “cloud provider revenue actuals” — market research firms like Korea IDC publish “market size estimates” using a different scope, so figures can vary.
Why is Korea’s SaaS market smaller than the global average?
Because SaaS accounts for only about 24% of Korea’s domestic software market, versus a global average of 41% (NIPA). In a market where on-premise software has long been the standard, the cost and psychological resistance to switching to a subscription model have been significant. Put differently, it also means there’s a lot of demand still waiting to convert — and a lot of room to grow.
How often is this statistics page updated?
At least once a year, with figures replaced based on the latest releases from primary sources (especially the Ministry of Science and ICT / NIPA Cloud Industry Survey, typically published in Q1 each year). The last-verified date is labeled at the top and bottom of the page; this page was last verified on June 11, 2026.
Marketing Insights
Marketing insights, delivered weekly
Practical growth and GEO/B2B marketing insights, summarized in your inbox every week.
Subscribe for insights