
The Complete Guide to SaaS Marketing: PLG vs. SLG, CAC and LTV, and the Korean Market
 임재복
임재복
SaaS marketing isn’t about designing a one-time sale — it’s about engineering ongoing use. There are three things you need to do, and they have an order. First, build a unit economics framework around CAC, LTV, and NRR. Then, based on the product’s ACV (annual contract value) and onboarding complexity, choose the growth model that fits: PLG (product-led growth) or SLG (sales-led growth). After that, invest early in compounding channels — like content and SEO — where customer acquisition cost falls the longer you run them. Follow this order and you build a growth curve without inflating ad spend. Break it, and you get trapped in a structure where losses grow the more you spend.
This guide walks through, in the order you’d actually apply it, why SaaS marketing differs from general marketing, how to calculate the core metrics, the PLG/SLG decision matrix, stage-by-stage strategy, channel design, what’s unique about the Korean market, and common failure patterns. Every number cited comes from a verifiable benchmark — David Skok’s SaaS Metrics 2.0, a16z’s 16 Startup Metrics, and the like. There’s one lens running through all of it: bringing in and keeping the one customer who will actually become revenue — not chasing traffic volume.
Why does SaaS marketing need a different approach than general marketing?
SaaS (Software as a Service) sells software as a subscription rather than a one-time license. That single difference changes marketing’s goals, metrics, and budget structure across the board. Bring over the playbook from general product marketing unchanged, and it fails in SaaS almost without exception. There are three reasons why.
Revenue happens over the ‘usage period,’ not at the ‘contract moment’
With a one-time sale, marketing cost is recovered at the first transaction. In SaaS, the first month’s subscription fee recovers only a tiny fraction of customer acquisition cost (CAC). The business only turns profitable once a customer sticks around long enough. According to David Skok’s analysis, even top-performing SaaS companies take 5–7 months to recover CAC, and profitability deteriorates sharply once the payback period passes 12 months. SaaS marketing isn’t about ‘the moment you close the deal’ — it’s about creating ‘the moment payback begins.’ The real outcome gets decided by what happens after that, in retention.
| Category | One-time sale model | SaaS subscription model |
|---|---|---|
| Revenue recognition | In full, at contract signing | Spread over the usage period (MRR/ARR) |
| Marketing cost recovery | Immediately, at the first sale | Months to over a year (CAC payback) |
| Marketing’s goal | Purchase conversion | Conversion + activation + retention + expansion |
| Key metrics | Sales volume, ROAS | CAC, LTV, NRR, payback period |
| Customer relationship | Ends at purchase | Starts at purchase (renewal, expansion, referral) |
| Cost of failure | Loss of that campaign | Full CAC loss plus lost future revenue, if the customer churns |
Retention is growth
SaaS is often compared to a ‘leaky bucket.’ No matter how much new water you pour in, if the hole from churn is big enough, the bucket never fills. Churn is dangerous because it compounds. A 2% monthly churn rate works out to losing about 21.5% of customers a year; at 5% monthly, you lose about 46% a year. With the exact same marketing budget, a different churn rate produces a completely different revenue curve a year later.
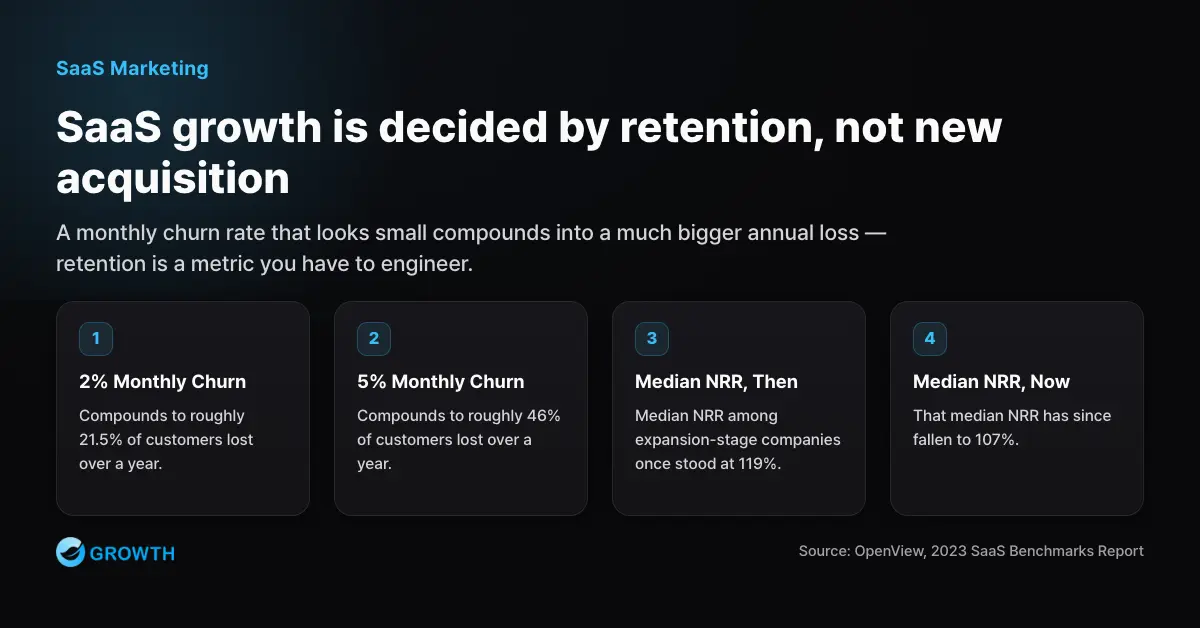
That’s why how SaaS measures churn has to be precise. a16z’s 16 Startup Metrics stresses that you must separate gross churn — the revenue you actually lost each month — from net revenue churn, where upsells offset that loss. If you only look at net churn, upsell revenue from existing customers can mask a growing hole in the bucket, and leadership discovers the problem too late. Market conditions are making retention harder too: according to OpenView’s 2023 SaaS Benchmarks report (a survey of 710 SaaS operators), NRR for the top quartile of growth-stage companies fell from 119% to 107%. Retention no longer comes for free — it’s a metric you have to design for.
The customer journey doesn’t end at the contract
A traditional marketing funnel ends at purchase. The SaaS customer journey runs awareness → evaluation → purchase → onboarding → activation → expansion → renewal → referral, and the larger share of revenue happens after the purchase. The basic framework for how customers explore and decide is covered in our customer decision journey (CDJ) guide. What’s different about SaaS is that a whole additional ‘journey after the contract’ gets tacked on.
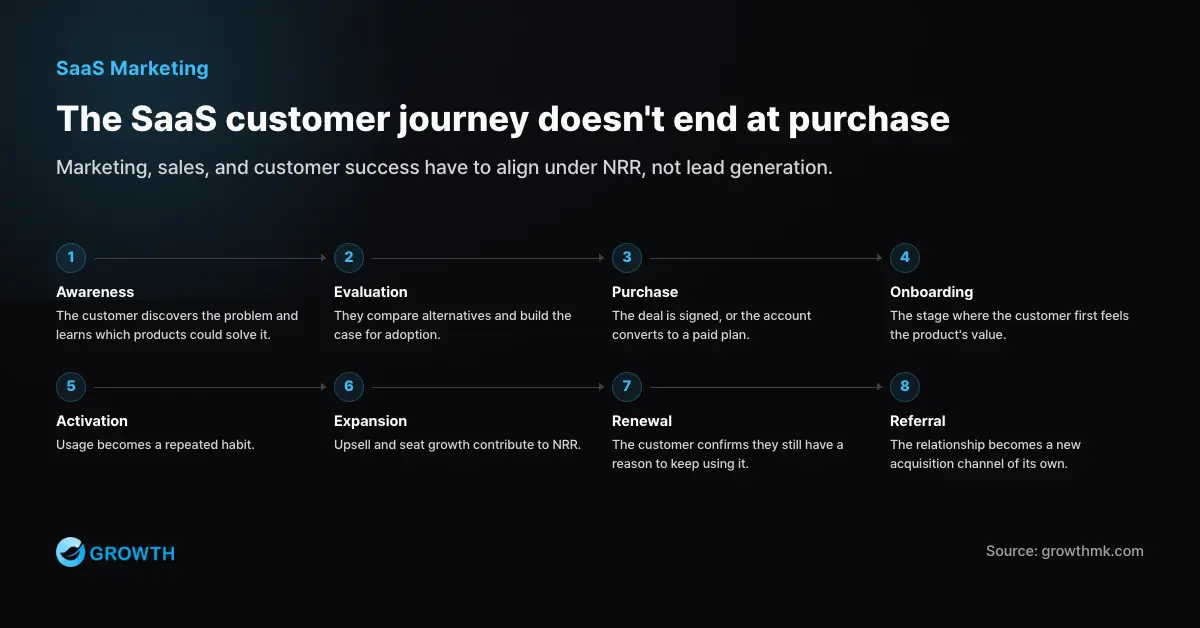
In this structure, marketing, sales, and customer success (CS) can’t operate as silos. If a customer marketing brought in fails to find value during onboarding and churns, the entire marketing investment turns into a loss. That’s why mature SaaS organizations align all three teams under a metric that runs through the whole journey — like NRR — rather than department-specific numbers. A SaaS marketer’s scope of responsibility doesn’t end at lead generation; it extends all the way to the point where that lead becomes lasting revenue.
The core SaaS metrics framework — CAC, LTV, payback, NRR
SaaS marketing decisions should start from unit economics, not gut feel. Once you know how much it costs to acquire one customer (CAC), how much that customer leaves behind over their lifetime (LTV), how many months it takes to recover the investment (payback), and whether existing customer revenue is growing on its own (NRR), how much to spend on which channel becomes a calculation rather than a guess. Getting just these five metrics right changes the quality of every marketing budget conversation.
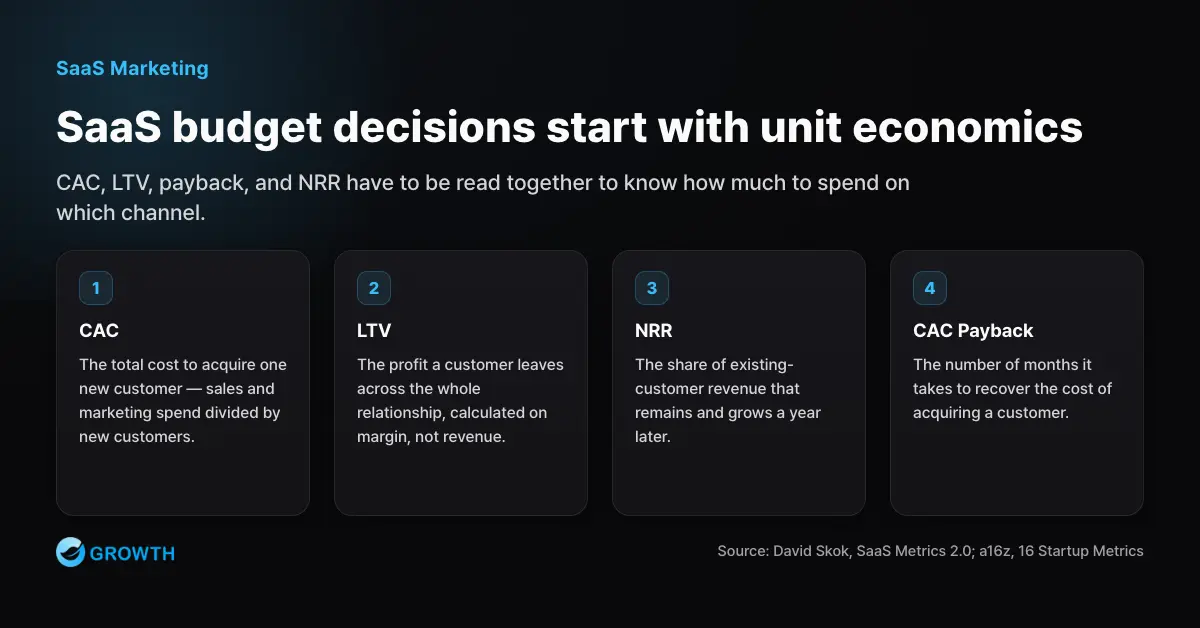
Definitions and baselines for the five core metrics
| Metric | Definition | Formula | Reference baseline |
|---|---|---|---|
| CAC (Customer Acquisition Cost) |
Total cost of acquiring one new customer (one company) | (Sales cost + marketing cost) ÷ number of new customers | No absolute benchmark — evaluate alongside LTV and payback (HubSpot) |
| LTV (Customer Lifetime Value) |
Profit one customer leaves behind over the entire relationship | (Monthly revenue per customer × gross margin) ÷ monthly churn rate | Calculate on margin, not revenue (a16z) |
| LTV:CAC | Lifetime value as a multiple of acquisition cost | LTV ÷ CAC | 3 or higher; top performers reach 7–8 (David Skok) |
| CAC payback | How long it takes to recover acquisition cost | CAC ÷ (monthly revenue per customer × gross margin) | Top performers: 5–7 months; over 12 months is a red flag (David Skok) |
| NRR (Net Revenue Retention) |
How much an existing customer cohort’s revenue has held up and grown one year later | (Current MRR from that cohort ÷ MRR 12 months ago) × 100 | SMB/mid-market: 90% good, 110% excellent; enterprise: 110% good, 130% excellent (Lenny Rachitsky) |
Three cautions are worth flagging. CAC’s numerator must include not just ad spend but sales and marketing salaries, commissions, content production costs, and tool costs. HubSpot’s definition explicitly includes salary, commission, and software costs within CAC’s scope. A CAC that counts only ad spend comes out artificially low and distorts your channel-scaling decisions. Nor should LTV be calculated on revenue. a16z defines LTV as ‘the net profit a customer leaves behind over the entire relationship,’ and names confusing it with revenue as the most common mistake in investment reviews. Alongside NRR, you should also look at gross retention rate (GRR — retention excluding upsells). If NRR is above 100% but GRR is low, it means expansion revenue from a handful of customers is masking churn among the majority.
A worked example — hypothetical B2B SaaS ‘Company A’
Numbers make this concrete. Let’s assume a hypothetical B2B SaaS company, Company A, selling a collaboration tool.
| Input | Value | Derived metric | Result |
|---|---|---|---|
| Total monthly sales + marketing spend | KRW 50 million | CAC | 50M ÷ 20 = KRW 2.5 million |
| New customers per month | 20 companies | ||
| Average monthly revenue per account (ARPA) | KRW 300,000 | CAC payback | 2.5M ÷ (300K × 0.75) = 11.1 months |
| Gross margin | 75% | LTV | (300K × 0.75) ÷ 0.02 = KRW 11.25 million |
| Monthly customer churn rate | 2% | LTV:CAC | 11.25M ÷ 2.5M = 4.5 |
The diagnosis reads like this: an LTV:CAC of 4.5 clears the 3x baseline, but an 11.1-month payback sits right up against the 12-month danger line. That means nearly a year’s worth of cash is tied up before it can be reinvested in growth — so Company A’s real priority next quarter isn’t ‘spend more on ads,’ it’s shortening the payback period. Improve onboarding to cut monthly churn from 2% to 1.5%, and LTV jumps to KRW 15 million with LTV:CAC hitting 6.0; raise ARPA through expansion revenue, and payback shrinks directly. Once the metrics framework is in place like this, ‘what to fix first’ stops being a debate and becomes the output of a calculation.
For an NRR example: say a customer cohort had a combined MRR of KRW 10 million 12 months ago, and since then lost KRW 1.5 million to churn and KRW 500,000 to downgrades while adding KRW 3 million through upsells. Current MRR is KRW 11 million, so NRR is 110%. But GRR for that same cohort is 80%, meaning this company’s profile is ‘strong at expansion, weak at defending against churn.’
The trap of averages — break things down by cohort and segment
Company-wide average CAC and average churn rate are nearly useless for decision-making. a16z recommends looking at Paid CAC — isolating just the paid channels — rather than a blended CAC that lumps in every cost, in order to judge paid-channel efficiency, and recommends confirming future retention with actual cohort data rather than assuming it. That’s because a blended CAC mixed with organic traffic creates the illusion that your ads are more efficient than they actually are.
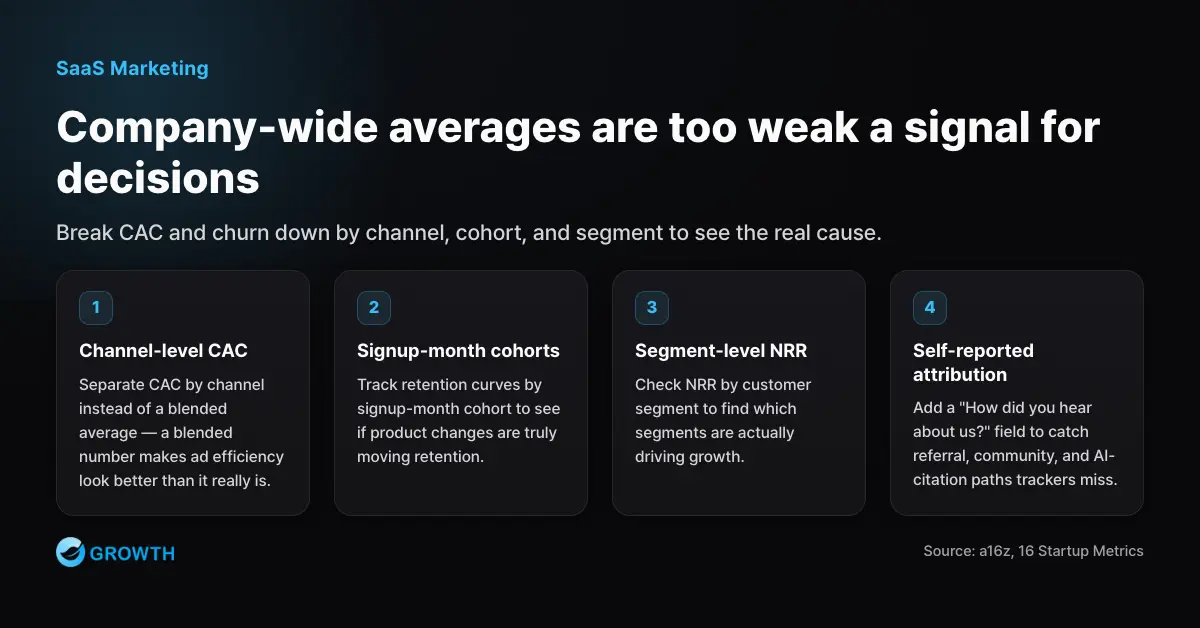
In practice, we recommend breaking things down along at least three axes: CAC by channel (which channel is bringing in customers you can actually recover the cost of?), retention curves by signup-month cohort (is a product improvement actually changing retention?), and NRR by customer segment (which customer group is the growing revenue?). Making this breakdown possible requires a tracking system that first connects signup, billing, and usage data — this is the point where SaaS marketing becomes a data-science discipline.
Attribution needs the same care. B2B SaaS buying journeys are long and touch many points, so if you allocate credit purely on a last-click basis, you systematically undervalue asset-type channels like content and SEO that built trust early in the review process. Looking at first-touch and mid-journey data together, and running a self-reported field on your signup form asking ‘how did you hear about us?’, lets you correct for paths your tracking tools miss entirely — referrals, communities, citations in AI answers.
PLG vs. SLG — which growth model should you choose?
Once your metrics framework is in place, the next question is your growth model. SaaS customer acquisition structures fall broadly into two camps: product-led growth (PLG) and sales-led growth (SLG). This choice cascades into organizational structure, pricing policy, and marketing channels alike.
Defining the two models
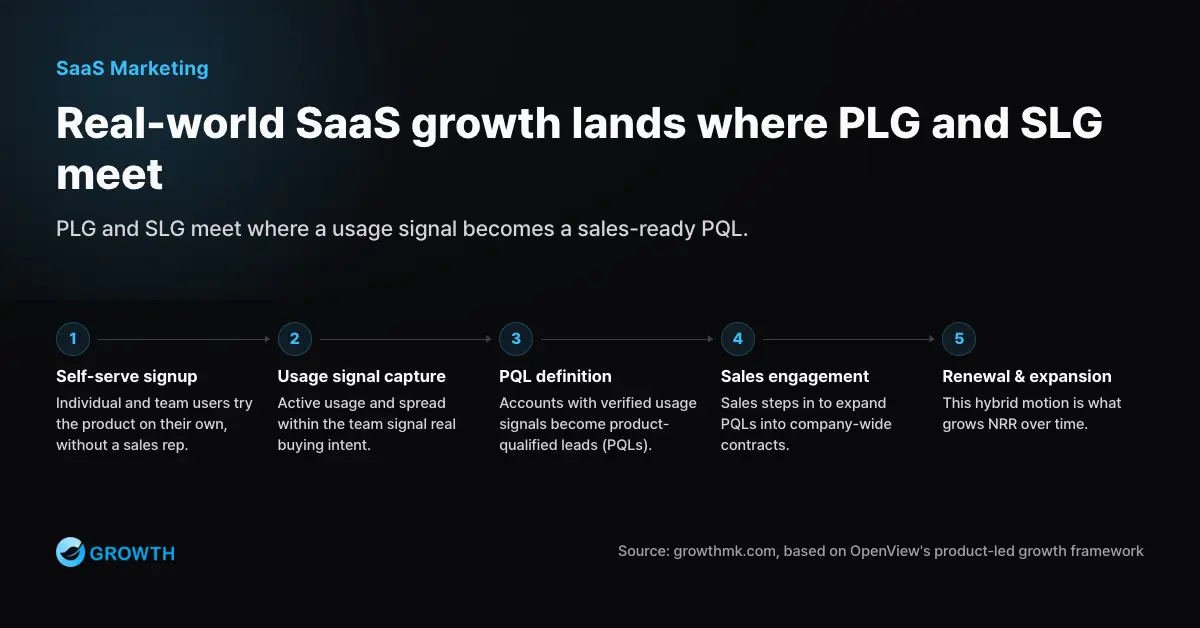
By OpenView’s definition, PLG is ‘an end-user-focused growth model where the product itself is the primary driver of customer acquisition, conversion, and expansion.’ Users sign up directly without going through a salesperson, try the product, feel its value, then pay — and usage spreads organically inside a team. Slack, Zoom, and Atlassian are cited as classic examples. Free Trial (time-limited access) and Freemium (a permanently free plan with core features) serve as the entry mechanisms. OpenView lists the conditions for PLG to work: remove friction from signup and onboarding, deliver value before payment, and hire a sales team last.
SLG, by contrast, is driven by the sales organization. Marketing generates leads, sales closes the deal through meetings, demos, proposals, and negotiation, and after adoption a dedicated team handles onboarding. This is the standard model for enterprise SaaS, where contract values are large and multiple departments are involved in the purchase decision.
| Category | PLG (product-led) | SLG (sales-led) |
|---|---|---|
| First customer touchpoint | Self-serve signup (trial or freemium) | Sales meeting or demo request |
| Purchase decision-maker | Spreads from end user → team → company | Decision-maker or buying committee (top-down) |
| Conversion mechanism | In-product onboarding, usage limits, upgrade prompts | Proposals, PoC, contract negotiation |
| CAC structure | Centered on product/content investment, low marginal cost | Centered on sales headcount, high cost per deal |
| Suitable ACV | Low to mid (a price point recoverable through self-serve) | High (a price point that justifies sales cost) |
| Onboarding | Solved inside the product so users feel value on their own | Built and supported by dedicated staff |
| Key leading indicator | Activation rate, PQL (product-qualified lead) | SQL, pipeline value, win rate |
| Representative examples | Slack, Zoom, Atlassian | Traditional enterprise software sales |
The decision matrix — judge by ACV and onboarding complexity
Which one fits isn’t a matter of taste — it’s a function of two variables: is the amount one customer pays per year (ACV) large enough to justify sales cost, and is onboarding simple enough that a customer can feel the value on their own, without help?
| Category | Simple onboarding (self-serve possible) | Complex onboarding (needs implementation support) |
|---|---|---|
| Low ACV | Fits PLG. Unit economics only work if self-serve minimizes acquisition cost | Danger zone. A low price point can’t recover onboarding cost — raising price or simplifying onboarding is a prerequisite |
| High ACV | Fits hybrid. Use PLG to gather users, then have sales expand into org-wide contracts (product-led sales) | Fits SLG. Enterprise sales with dedicated onboarding is the standard playbook |
The cell to watch out for is the bottom-left danger zone. A product with a low price point but complex onboarding can’t make unit economics work no matter which growth model you attach to it. In this case, more marketing isn’t the answer. The prerequisite is a product-level decision — raise the price and move to SLG, or simplify onboarding and move to PLG. This is the classic case where a marketing diagnosis turns into a product strategy diagnosis.
Free trial vs. freemium — how do you choose your entry mechanism?
If you’ve chosen PLG, you need to design your entry mechanism. Even though both are self-serve, free trial and freemium work on different principles.
| Category | Free trial (time-limited access) | Freemium (permanent free plan) |
|---|---|---|
| Fits products where | Time-to-value is short and the value is complete even for a single user | Value grows the more users join — collaborative or network-effect products |
| Strength | A deadline drives fast decisions and a clear moment of conversion | Minimal barrier to entry; spreading through a team builds up latent pipeline |
| Risk | If a user doesn’t experience core value in time, the lead evaporates | Infrastructure and support costs add up; without a strong upgrade driver, users just live on the free plan forever |
| Key metrics to manage | Trial-to-paid conversion rate, activation reach rate | Free-to-paid conversion rate, number of users spread per account |
Either way, the underlying condition is the same. OpenView’s PLG principle of ‘deliver value before payment’ has to actually hold true. If a product’s entire trial period gets used up on setup, the priority isn’t extending the trial length — it’s shortening the path to first value. And if freemium isn’t converting well to paid, you need to redraw the plan boundaries — usage, features, seats — based on data.
Reality tends to converge on a hybrid
PLG and SLG aren’t an either/or choice. Most mature PLG companies attach a sales team to deals above a certain size, and define accounts showing purchase signals in product usage data as PQLs (product-qualified leads) that get handed off to sales. Conversely, SLG companies increasingly adopt trial environments and self-serve demos to let the product do work before sales gets involved. Data also confirms that PLG isn’t a silver bullet — in OpenView’s 2023 benchmarks, the median growth rate for PLG companies fell from 45% to 29%. A model only sets the structure — it doesn’t guarantee results. Results come from the value the product delivers and the quality of the execution that delivers it.
Stage-by-stage SaaS marketing strategy — pre-PMF, early traction, scale
Even within SaaS, the right marketing answer changes by stage. The most common waste is running activities that don’t fit your stage — burning ad spend before PMF (product-market fit) is even confirmed, or still relying on the founder’s personal network for sales after you’ve entered scale-up.
| Stage | The key question | Key metric | Marketing priority | What to avoid |
|---|---|---|---|---|
| Pre-PMF | Does anyone exist who’d be genuinely stuck without this product? | Retention curve flattening, qualitative feedback | Customer interviews, securing early users, problem-focused content | Scaling up paid ads, scaling up hiring |
| Early traction | Is there a repeatable acquisition formula? | CAC by channel, activation rate, payback | Rigorously validate 1–2 channels, design experiments, build a case library | Expanding into many channels at once, relying on averaged metrics |
| Scale | Are retention and expansion revenue holding up growth? | NRR, LTV:CAC, retention by segment | Content hubs / SEO as an asset, channel diversification, designing expansion revenue | Skewing toward new acquisition while neglecting retention, zero brand investment |
Pre-PMF — this is not the stage to scale up marketing
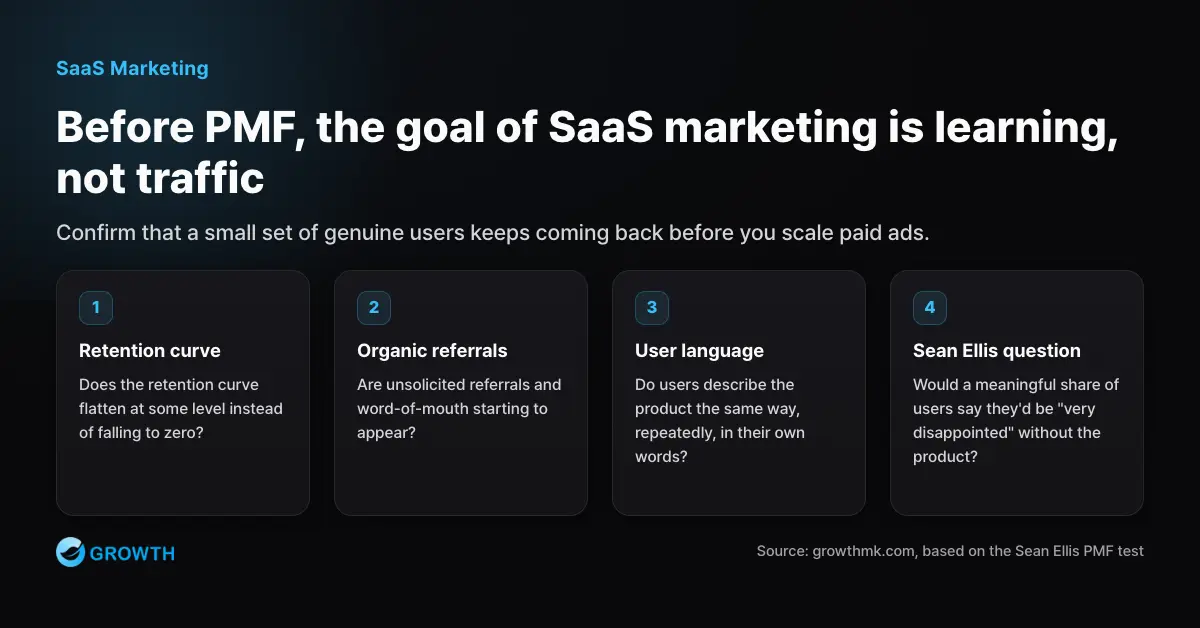
The goal at this stage is learning, not traffic. All that matters is whether a small group of true believers keeps using the product (where the cohort retention curve flattens out), and how they’d describe the product in their own words. Signs of PMF usually show up when three things overlap: the retention curve flattens at some level instead of dropping to zero, unsolicited referrals or word-of-mouth signups start appearing, and a meaningful share of respondents to the survey question ‘how would you feel if you could no longer use this product?’ (the Sean Ellis test) answer ‘very disappointed.’ At this stage, marketing activity should be limited to reaching out directly to where your target customers already gather, plus a handful of content pieces that address the problems they’re actually searching for. Scaling up paid ads during this window just pours traffic onto a product without PMF and produces nothing but churn data.
Early traction — find a repeatable formula in one or two channels
Once signs of PMF appear, it’s time to validate ‘which channel, at what cost, brings in which customers.’ The key is not to spread across many channels at once, but to run a fast cycle of hypothesis → experiment → measure → learn in just one or two channels. This experimentation methodology is covered in detail alongside the AARRR framework in our growth hacking guide. What this stage produces isn’t revenue itself so much as ‘a validated acquisition formula, with CAC and payback confirmed by channel,’ and early customer stories that become ammunition for the sales and content that comes next.
Scale — shift the balance from new acquisition toward retention and expansion
At scale, the growth formula is ‘new MRR + expansion MRR − churned MRR.’ A company that grows purely through new acquisition and one backed by 110% NRR draw completely different curves on the exact same marketing budget. At this stage, you need to both scale up budget on validated channels and put marketing capability into the post-contract journey — onboarding improvement, usage expansion, upsell scenarios. Content also needs to graduate from individual posts and get structured into topic hubs (topic clusters) that compound as a search asset.
Expansion revenue doesn’t happen by accident. Define upsell triggers with data — accounts nearing their plan’s usage limit, accounts adding seats quickly, accounts repeatedly checking a higher-tier-only feature — and design a flow where those signals automatically trigger in-product prompts and outreach from a rep. Just as it helps to propose a value review 90 days before renewal, defending against churn should also be run off signals, not off a calendar — that’s what expansion-stage marketing actually looks like in practice.
Why are content and SEO SaaS’s core channels?
The starting point for channel strategy is whether it matches your unit economics. Because SaaS generates LTV over a long horizon, a channel that looks expensive up front but gets cheaper over time is structurally advantageous. That’s exactly why content and SEO have become the standard SaaS channel.
Ads are rented; content is owned
Paid ads are a rented channel — stop spending, and traffic stops. Cost is incurred fresh for every customer, and as competition drives up bids, CAC tends to climb over time rather than fall. Content and SEO, on the other hand, only cost you upfront in production; once a piece ranks, it keeps driving traffic for years with no additional spend. As more pieces accumulate, the site’s overall topical authority rises, which speeds up ranking for new content too — a textbook compounding structure. The more a SaaS company’s channel mix leans toward asset-type channels, the more its blended CAC falls over time, and the more growth it buys for the same budget.
| Channel | Nature | CAC trend | Fitting stage | Notes |
|---|---|---|---|---|
| Content / SEO | Asset-type | Falls over time | Early traction through scale (start early) | Takes months to pay off — recoverable because SaaS LTV is long |
| GEO (AI search optimization) | Asset-type | Large first-mover advantage | All stages | Structuring content to be cited in AI answers is key |
| Paid search / social ads | Rented | Rises as competition intensifies | Channel validation, demand capture, retargeting | Its strength is fast validation of messaging and segments |
| Outbound / sales development | Rented (labor cost) | Expensive per unit, justified at high ACV | SLG / enterprise | Success hinges on the quality of target-account selection |
| Community / referral / word-of-mouth | Asset-type | Very low | Requires PLG in place first | Assumes product satisfaction — hard to engineer artificially |
| Review platforms / directories | Semi-asset-type | Low | Captures the comparison/review stage | A trust-verification channel right before purchase |
This doesn’t mean rented channels are unnecessary. Paid ads remain effective for quickly validating messaging and segments, and for capturing demand right before purchase. They also fill the gap while asset-type channels are still building up. That said, once ad dependence hardens, the cost structure starts eating into growth — the mechanism and how to escape it are covered separately in our complete guide to performance marketing.
In B2B SaaS, lead quality decides success — not lead volume
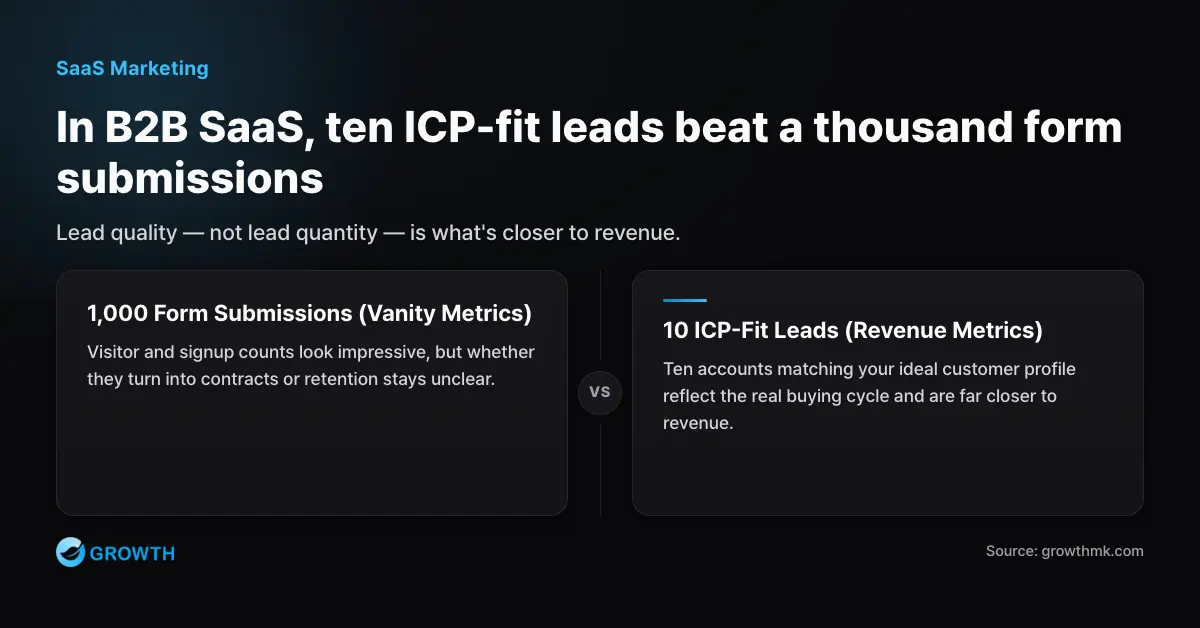
B2B SaaS purchases involve long review periods and multiple stakeholders, so marketing performance should be measured not by visitor count but by ‘how many leads did we bring in who’ll actually convert into contracts and stick around.’ Ten form submissions that fit your ICP (ideal customer profile) are closer to revenue than 1,000 that don’t. Aligning content topics and conversion design around the one customer who will become revenue — not traffic volume — is the essence of B2B SaaS content strategy. Concrete methods for raising lead quality are covered in our B2B lead generation guide, and the higher-level strategy spanning channels, ABM, and measurement is laid out in our complete guide to B2B marketing.
Fill in content topics starting with the keywords closest to purchase
The most common mistake when starting content and SEO is going after high-volume, generic keywords first. Early-stage SaaS has limited content resources, so you should fill in topics in order of fastest payback. The recommended order runs from the bottom of the funnel to the top.
- Bottom-of-funnel (BOFU) keywords — ‘comparison, alternative, pricing, adoption.’ Searches like “X alternative,” “X vs. Y,” or “X pricing” are low-volume but come from someone already actively considering a purchase. Even a keyword with a search volume of 10 is closer to revenue than an informational keyword with a volume of 10,000, if it converts even one person into a contract.
- Mid-funnel (MOFU) keywords. These are searches for the problem your product solves — design the content so that, in the process of solving the problem, the product naturally becomes part of the answer.
- Top-of-funnel (TOFU) keywords. High-volume topics like category or concept definitions should be tackled only after you’ve built up domain authority — that’s when both your odds of ranking and your payback improve.
This order is simply the principle of ‘the one customer who becomes revenue over traffic volume,’ applied directly to a content roadmap. For the same reason, content performance reporting should be built around signups and pipeline contribution driven through content — not pageviews.
The AI search era — content that gets cited in comparison and recommendation answers
‘Exploring alternatives’ — the very start of the SaaS buying journey — is increasingly moving to generative AI. In an environment where AI directly composes answers to questions like “recommend a collaboration tool” or “which is better, A or B?”, whether your product and content get cited in the AI’s answer becomes a new form of competitive visibility, alongside search rankings. Structured content built around comparison tables, definitions, and supporting data has an edge at getting cited. This optimization methodology is covered systematically in our GEO (generative engine optimization) guide. Companies that have already built up SEO assets face lower conversion costs into GEO, making content investment a double compounding effect.
What’s unique about the Korean SaaS market
Before transplanting a global playbook wholesale, there are three structural facts about the Korean market worth confirming.
The domestic market is small, so global expansion is often a given
According to reporting from Digital Daily, Korea’s domestic SaaS market was worth roughly KRW 2.136 trillion as of 2023 — only about 0.5% of the global SaaS market. That means horizontal SaaS often can’t reach meaningful scale on domestic demand alone, and in practice, many Korean SaaS companies are designed with global markets in mind from the founding stage. Analysis from the Software Policy & Research Institute (SPRi) assesses that Korean SaaS global expansion is still at an early stage, while also pointing to emerging cases like Sendbird — headquartered in the US, serving 150+ countries, and counting Reddit and Yahoo among its customers.
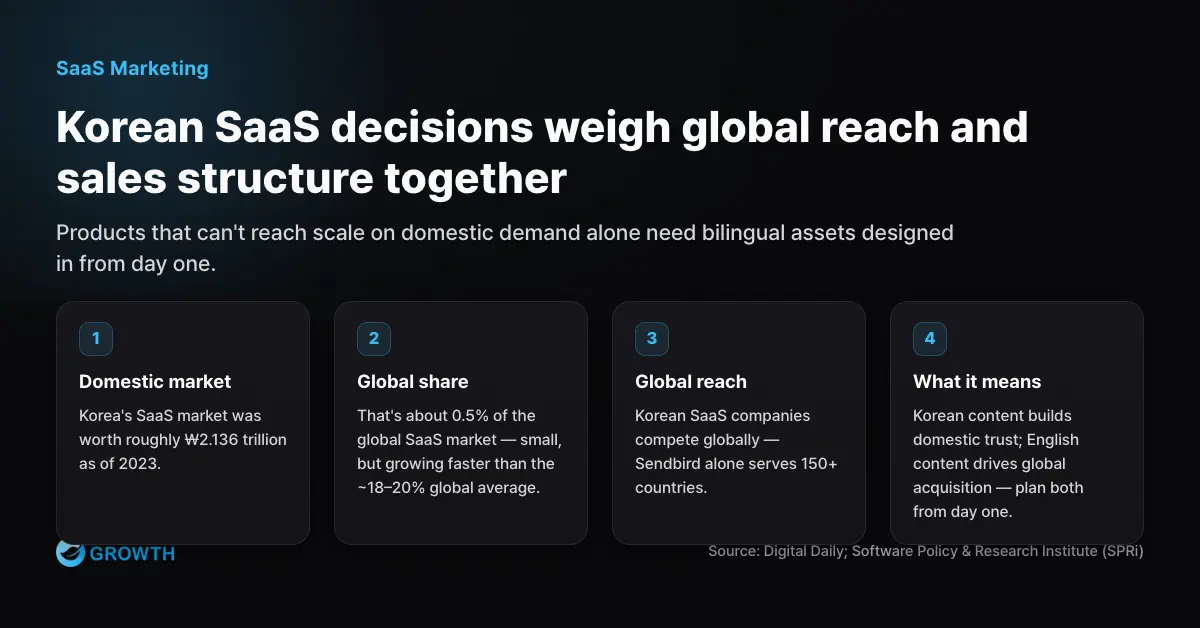
The marketing implication is clear. If you’re a SaaS company with global expansion in mind, it’s more cost-efficient to design content and SEO assets bilingually — Korean and English — from the start, and to prepare for listing on global review platforms and claiming English-language comparison keywords starting from the early-traction stage. The same report names multilingual and multi-national support, compliance with data protection regulations (like GDPR), flexible pricing, and effective global marketing as the key elements of successful expansion.
Korean enterprise buying culture leans heavily sales-led
The same SPRi report summarizes the traditional Korean software market as: a customer base centered on large corporations and government institutions, sales led by in-person meetings and consulting, long-term relationship building, and mandatory contract negotiation and customization. This buying culture carries over substantially into how SaaS gets evaluated, too — Korean enterprise customers frequently require a proposal, demo, security review, and reference check before adopting. In regulated industries like public sector and finance, security certification and data-residency requirements can even become prerequisites for purchase.
For SaaS targeting Korean enterprise, closing a deal on pure PLG alone is often difficult. A more realistic combination is content and search claiming trust early in the review process, with sales closing the deal. Because multiple departments are typically involved in the decision, it’s effective to prepare separate materials — in-depth resources for practitioners and a business case for decision-makers.
Three practical takeaways
- Split your growth model by market. The same product might lean SLG for the domestic enterprise market and PLG for global self-serve — the right model mix can differ by market.
- Design content assets bilingually. Korean content plays a different role — building domestic trust — than English content, which drives global acquisition.
- Treat the translated-content gap in Korean SERPs as an opportunity. Korean-language search results on SaaS marketing are often just translations or summaries of foreign material — an area where original content grounded in Korean market context can more easily claim authority.
7 common SaaS marketing failure patterns
Finally, here are the failure patterns we see repeatedly in the field, along with their symptoms and how to correct course. Most of them aren’t a channel or creative problem — they’re a structure and sequencing problem.
| Failure pattern | Symptom | How to correct it |
|---|---|---|
| 1. Pouring water into a leaky bucket | New signups keep climbing but MRR is stuck | Diagnose churn causes and fix onboarding before scaling acquisition (retention first) |
| 2. The blended-CAC illusion | Ad reports look great but cash is drying up | Isolate Paid CAC and measure payback by channel |
| 3. Overstated LTV | LTV:CAC looks great but losses persist | Recalculate LTV on margin, not revenue |
| 4. Over-marketing before PMF | Lots of traffic, but the retention curve drops to zero | Halt ads; go back to customer interviews and product improvement |
| 5. Growth-model mismatch | Expensive sales on a low-price product, or a complex product left to pure self-serve | Realign the model using the ACV × onboarding-complexity matrix |
| 6. Reporting fixated on lead volume | MQL targets hit, but revenue contribution unclear | Swap in ICP-fit leads, pipeline value, and win-rate contribution as your metrics |
| 7. Giving up on asset-type channels too soon | Declaring content ‘not working’ after just 3 months | Evaluate asset-type channels annually, not quarterly, and track leading indicators (ranking, citations, conversion) |
The common denominator across all seven is the absence of a measurement system. Without tracking, you get fooled by averages, and once you’re fooled by averages, budget flows to the wrong place. Conversely, with measurement in place at the cohort, segment, and channel level, most of these patterns get caught early, in a quarterly review. SaaS marketing’s edge doesn’t come from flashy campaigns — it comes from a data system that lets you see the truth faster than everyone else.
Growth offers a B2B marketing service that actually executes this guide’s methodology end to end — from building a metrics framework for B2B/SaaS companies, to building content and SEO assets, to running lead-quality-first campaigns. If you’d like a growth-model diagnosis suited to your stage and market, reach out via consultation.
Execution guides in this cluster
- How to Choose a SaaS Marketing Agency — 5 Evaluation Criteria and Questions to Ask
- B2B SaaS Lead Generation — the PQL Structure Behind More Demo Requests
- Korean SaaS Market Statistics — Market Size, Growth Rate, Investment, and Adoption Trends (sourced)
Frequently asked questions (FAQ)
What percentage of revenue should a SaaS marketing budget be?
We don’t recommend a one-size-fits-all ratio, because the right level differs completely by stage (pre-PMF vs. scale) and growth model (PLG vs. SLG). Instead, work backward from guardrail metrics: increase budget on validated channels only within the range where CAC payback stays under 12 months and LTV:CAC holds at 3 or above. If payback is short and retention is solid, spend aggressively; if it’s the opposite, the fix isn’t budget size — it’s your unit economics.
What’s a good LTV:CAC ratio?
The widely used benchmark is 3:1 or higher, from David Skok, with top-performing SaaS companies reaching 7–8. Two caveats, though: early-stage companies commonly fall short of this benchmark, so the trend of improvement matters more than the absolute number, and a ratio that’s too high (say, above 10) can actually signal under-investment in growth. Always view LTV:CAC alongside CAC payback — a good ratio doesn’t help if recovery is slow enough to dry up your cash.
Do we have to choose only one of PLG or SLG?
No. The two models aren’t mutually exclusive, and most mature SaaS companies run a hybrid. A common pattern: self-serve brings in individual or team users, and sales steps in on accounts showing purchase signals in product usage data (PQLs), growing them into org-wide contracts. The deciding factors are ACV and onboarding complexity — a low price point with simple onboarding favors more PLG, while a high price point with complex adoption favors more SLG, in line with unit economics.
What does it mean when NRR exceeds 100%?
It means company revenue grows on its own — even without adding a single new customer — because upgrade and expansion revenue from existing customers outpaces churn losses. As a benchmark, 110% is considered excellent for SMB/mid-market SaaS, while for enterprise SaaS, 110% is good and 130% is top-tier. That said, if NRR looks good but gross retention (GRR) is low, it means expansion revenue from a handful of customers is masking churn among the majority — so you need to check both metrics together.
What’s the very first thing to do when starting SaaS marketing in Korea?
Build your measurement system first. We recommend connecting signup, billing, and usage data so you can view CAC, payback, and cohort retention by channel, then defining your ICP (ideal customer profile), and only then choosing a growth model (PLG, SLG, or hybrid). On the channel side, start earliest with asset-type channels like content and SEO that take time to pay off — but if global expansion is on the roadmap, designing Korean and English content in parallel from day one significantly cuts your future conversion cost.