
Core Web Vitals: Definition and How to Measure Them
 임재복
임재복
Is website speed just a number? Not really. Website speed is a factor that shapes customers’ purchase decisions — and, by extension, whether a business succeeds or fails. According to joint research from Google and Deloitte, every 0.1-second improvement in page load time can lift conversion rates by up to 10.1%. That’s a metric with a direct line to revenue.
So how should you measure and improve website speed in a fast-moving digital landscape? Google’s answer is a set of core metrics called “Core Web Vitals.” Core Web Vitals are essential for objectively evaluating and improving a webpage’s user experience. In this article, we’ll walk through what Core Web Vitals are, how to measure them, and how to improve them.
What Are Core Web Vitals?
Core Web Vitals are metrics that measure how fast, stable, and pleasant a webpage is to use. They objectively assess a page’s loading speed, responsiveness, and visual stability, all in service of improving user satisfaction.
The concept spans both “site speed” — how the site performs overall — and “page speed,” the loading speed of an individual page. In other words, Core Web Vitals let you comprehensively evaluate user experience, both across the site and page by page.
The Core Web Vitals Metrics
Core Web Vitals is made up of three core metrics.
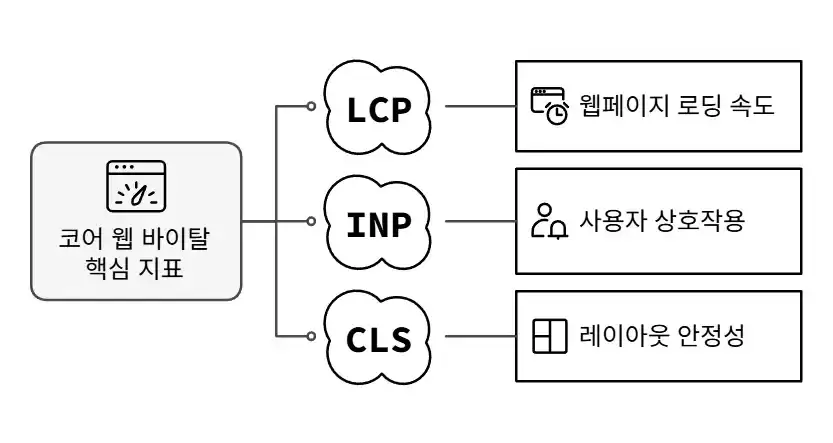
LCP (Largest Contentful Paint)
LCP measures how long it takes for the largest piece of content on a webpage — an image, video, or block of text — to render on screen. It reflects how quickly the content users notice first actually finishes loading when they land on a page. A poor LCP score signals slow page-load speed, which can drive up bounce rates.
- Ideal LCP: within 2.5 seconds. (Google’s web.dev recommendation, measured at the 75th percentile of page loads)
INP (Interaction to Next Paint)
INP is the core metric Google newly added to Core Web Vitals in March 2024, replacing FID. It measures how long it takes for visual feedback (the next paint) to appear after a user interacts with a page — clicking, tapping, typing, and so on. In short, it’s a measure of a page’s overall responsiveness. INP observes the latency of nearly every interaction that happens on a page and uses the longest one as its representative value.
- Ideal INP: 200 milliseconds or less. (Google’s web.dev recommendation)
- How it improves on FID (First Input Delay):
- FID only measured the delay on the first input, while INP accounts for every interaction on the page.
- INP measures responsiveness more comprehensively — it includes not just input-processing time, but also how long the browser takes to paint the next frame.
CLS (Cumulative Layout Shift)
CLS measures how much content unexpectedly shifts position while a webpage is loading. A sudden shift in content position can startle users and lead to mis-clicks. The CLS score reflects the degree of this layout instability — the higher the score, the more unstable the page, and the worse the user experience.
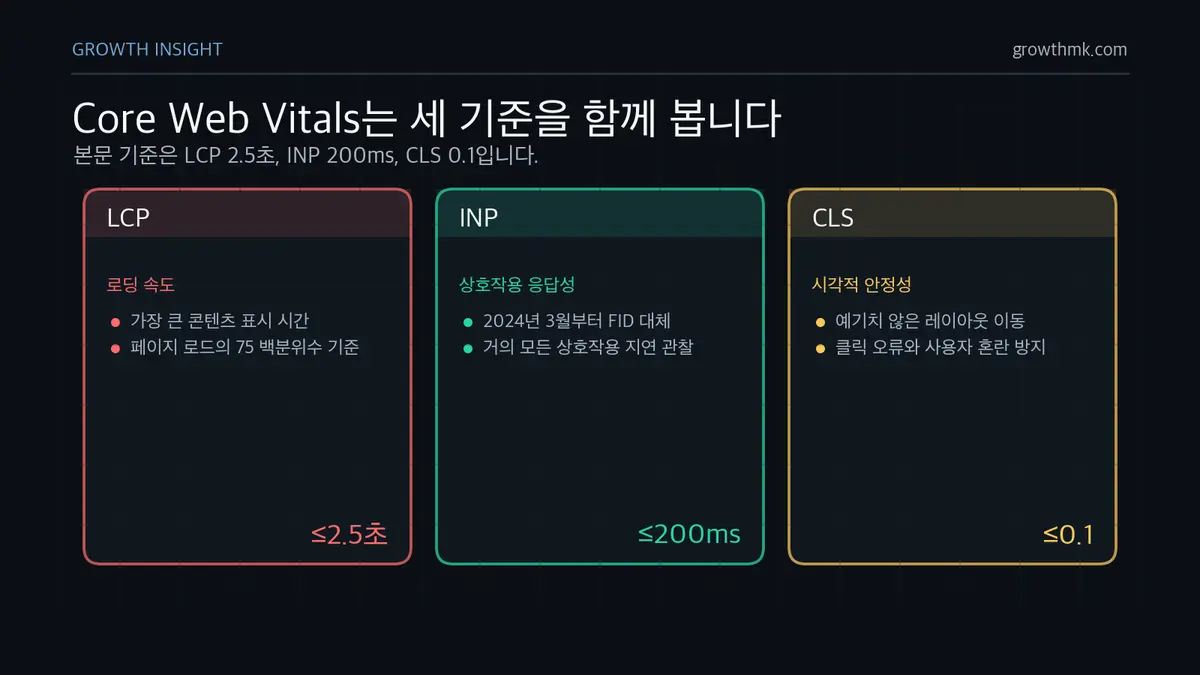
- Ideal CLS: 0.1 or lower. (Google’s web.dev recommendation)
How to Measure Core Web Vitals
There’s more than one way to measure Core Web Vitals. Google’s own tools — PageSpeed Insights, Lighthouse, and Search Console — make it easy to check a webpage’s Core Web Vitals scores. You can also measure and analyze the metrics in real time using Chrome’s built-in developer tools.
PageSpeed Insights
PageSpeed Insights is Google’s free tool for analyzing a webpage’s performance and suggesting ways to improve it. Enter a URL, and it shows you a range of performance metrics — including LCP, FID, and CLS scores — along with concrete recommendations for speeding up the page.

Lighthouse
Lighthouse is an open-source tool for evaluating webpage quality. It’s built into the Chrome browser and analyzes a page across performance, accessibility, SEO, PWA support, and more. With Lighthouse, you can check your Core Web Vitals scores and get a detailed report on how to improve them.
Search Console
Search Console is Google’s free service for monitoring and managing a website’s search engine (SEO) performance. Its “Core Web Vitals” report lets you see the overall state of your site’s Core Web Vitals and identify problem pages you can then work on improving.
Chrome DevTools
Chrome’s developer tools are a powerful way to analyze and debug a webpage. Using the “Performance” panel in DevTools, you can examine a page’s loading process in detail and measure Core Web Vitals metrics like LCP, FID, and CLS in real time.

How to Improve Core Web Vitals
If your measurements turn up a problem, here’s how to fix it.
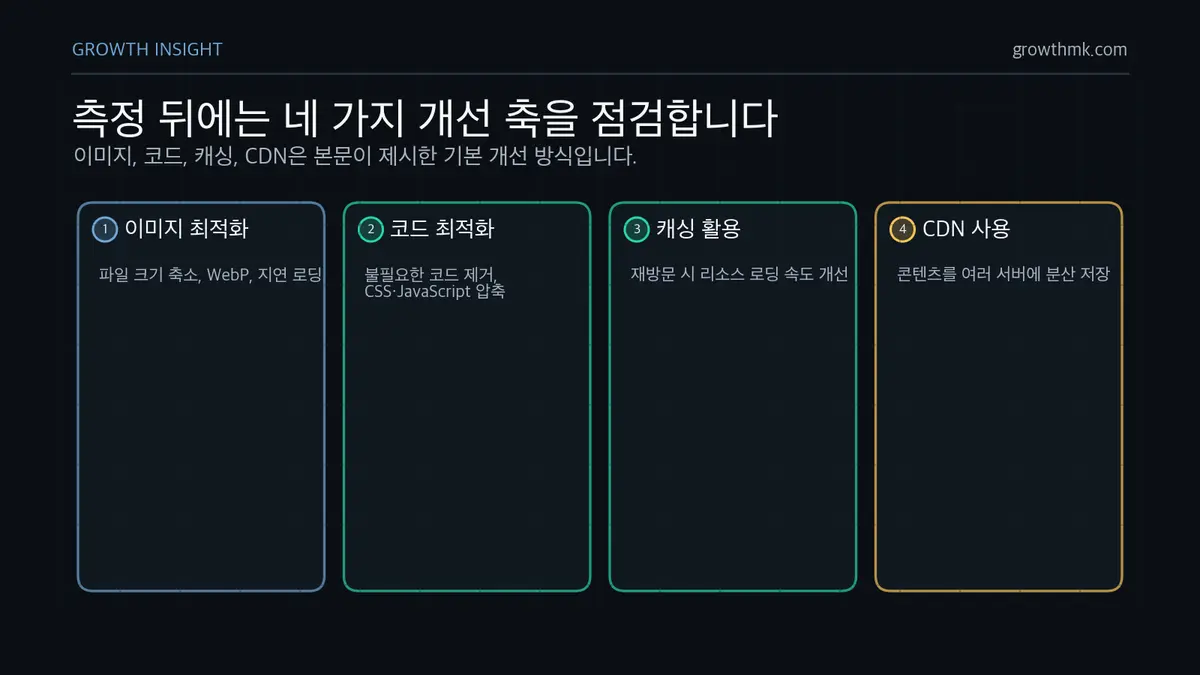
- Optimize images: reduce image file size and use a web-optimized format (like WebP). Lazy-loading images can also improve initial load speed.
- Optimize code: remove unnecessary code and minify your CSS and JavaScript files to shrink the page’s overall size.
- Use caching: leverage browser caching to store webpage resources locally, speeding up load times on repeat visits.
- Use a CDN: a content delivery network (CDN) distributes your webpage’s content across multiple servers and serves it from whichever server is closest to the user, improving load speed.
- Shorten server response time: reducing server response time improves how fast a webpage loads.
Conclusion: Core Web Vitals for Better User Satisfaction and Business Growth
Improving Core Web Vitals raises user satisfaction, lowers bounce rates, and, ultimately, drives business growth. A fast, stable webpage gives users a positive experience, which raises return-visit rates and strengthens brand image.
Google also factors Core Web Vitals into how it ranks websites. In fact, Google Search’s official documentation states plainly that “Core Web Vitals are used in our (Google’s) ranking systems.” That said, page experience alone doesn’t guarantee top placement — when content relevance and quality back it up as well, your odds of ranking well in search results go up, which brings in more organic traffic.
Related reading
- The Complete Technical SEO Guide: A Practical Hub Connecting Crawling, Indexing, Rendering, Speed, and Structure
- The Canonical Tag
- Why Sitemaps Matter and 3 Ways to Create One
- How to Fix Open Graph Tag Errors
- The H1 Tag: Definition and Correct Usage
If you want to apply this to your own business — you can see Growth’s approach on our SEO services page, and if you need a concrete assessment of your situation, reach out through our consultation contact form. We answer in terms of the one customer who becomes revenue, not raw traffic volume.
FAQ
What actually changed when INP replaced FID?
FID (First Input Delay) only measured the delay on a user’s first input, while INP (Interaction to Next Paint) observes the latency of nearly every interaction on the page and uses the longest one as its representative value. It also includes not just input-processing time but the time the browser takes to paint the next frame, giving a more complete picture of a page’s overall responsiveness. Google’s web.dev defines INP as FID’s successor metric and sets 200 milliseconds or less as the bar for good responsiveness.
Where can I measure my Core Web Vitals scores?
You can check your scores with Google’s own tools — PageSpeed Insights, Lighthouse, and Search Console. PageSpeed Insights just needs a URL and returns your metrics plus improvement suggestions; Lighthouse is built into Chrome and provides a detailed report; and Search Console’s “Core Web Vitals” report helps identify problem pages across your entire site. Chrome DevTools’ “Performance” panel also lets you measure in real time.
Do Core Web Vitals directly affect search rankings?
Yes, they do. Google Search’s official documentation states that Core Web Vitals are used in its ranking systems. That said, no single signal guarantees top placement on its own — content relevance and quality take priority. In practice, it’s more accurate to think of good page experience as a “plus factor” that contributes to search performance, all else being equal.
Mobile and desktop scores differ — which one should I use as the benchmark?
The web.dev guide recommends measuring Core Web Vitals targets like LCP and CLS at the 75th percentile of page loads, separately for mobile and desktop. In other words, what matters isn’t a single measurement but whether the value most users (the top 75%) actually experience meets the threshold. If your traffic skews mobile, it’s practical to check your mobile scores first.
Marketing Insights
Marketing insights, delivered weekly
Practical growth and GEO/B2B marketing insights, summarized in your inbox every week.
Subscribe for insights