
GEO ROI Measurement: 5 KPIs and Designing an Executive Dashboard
 임재복
임재복
This article is chapter 19/20 of Growth’s GEO Whitepaper series — Ch.13, ROI Measurement. You can find the full table of contents and the complete PDF on the whitepaper page.
The core KPI for GEO is Share of Answer (SoA) — your brand’s citation share within AI answers. AI-referred traffic converts at a much higher value than ordinary search traffic (4.4x in Semrush’s analysis, 23x in Ahrefs’ own data), so its contribution to revenue is worth more than raw traffic volume suggests. But SoA alone can’t give you the full picture of GEO (Generative Engine Optimization) performance. You need to measure it in three dimensions across five KPIs.
The 5 core KPIs of GEO — what you actually need to measure
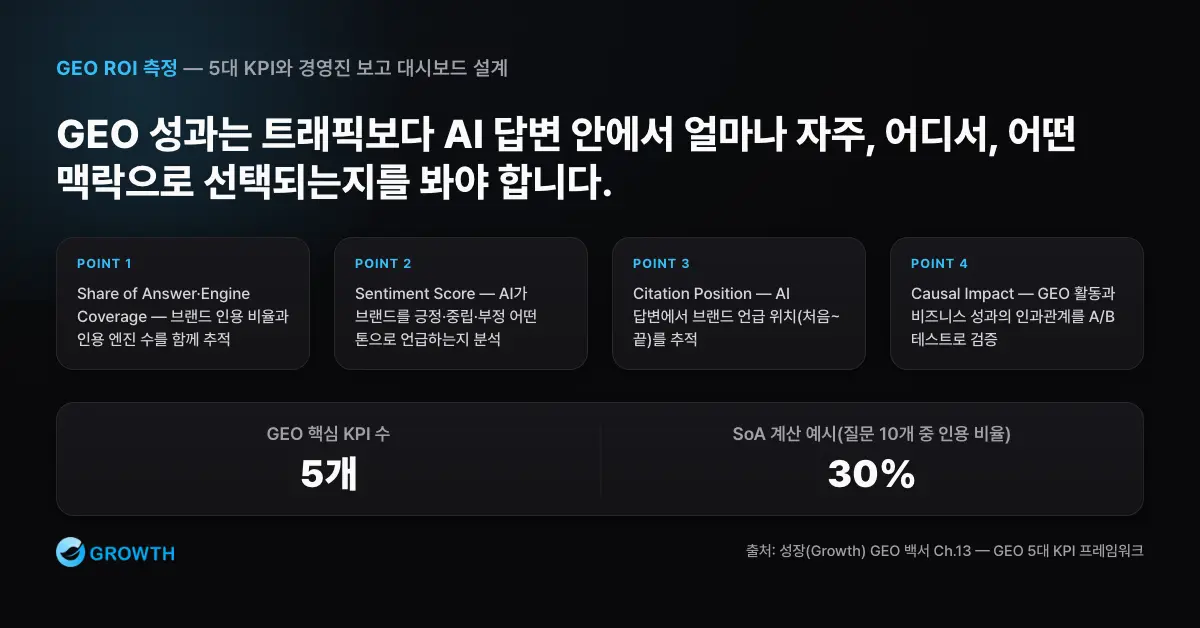
First, Share of Answer (citation share within answers). Select 100 core industry questions and track the rate at which your brand is cited across major AI engines’ answers to each one. For example, if you ask “recommended B2B marketing agency” across ChatGPT, Perplexity, Google AIO, and Naver AI, and your brand is mentioned in 3 out of 10 answers, your SoA is 30%. Tracking this monthly lets you see the direct impact of your GEO activity.
Second, Engine Coverage. This measures how many different AI engines cite your brand. SearchAtlas’s analysis of LLM citation behavior found that the three major engines shared at least one common source domain for the same query in only 60–65% of cases, while the remaining 35–40% of queries cited completely disjoint sets of sources. Being cited by only one engine versus by many creates a huge difference in reach. Relying on a single engine is a risk.
Third, Sentiment Score. This analyzes whether AI mentions your brand positively, neutrally, or negatively when citing it. Being cited at all matters, but there’s a world of difference in business impact between being described as “a trusted company in this space” and as “a company with controversies.”
Fourth, Citation Position. This tracks whether your brand is mentioned first or last within an AI’s answer. As Liu et al.’s (2024) “Lost in the Middle” research shows, language models make the best use of information at the beginning and end of an input context and tend to miss information in the middle — and users reading an answer likewise focus their attention on the earlier parts. Citation position has a direct effect on user perception.
Fifth, Causal Impact. This statistically validates the causal relationship between GEO activity and business outcomes (leads, revenue, conversions). To establish causation rather than mere correlation, use methodologies like A/B testing or time-series analysis.
For the four practical AI-citation-tracking methods you use to follow these KPIs day to day, the GEO Measurement Guide is the definitive reference, and you can see where measurement fits into the overall strategy at a glance in the full GEO Whitepaper table of contents.
The 5-dimensional model of AI visibility
We propose a 5-dimensional model, adapted for practical use, based on the multi-dimensional evaluation framework in CC-GSEO-Bench (Chen et al., 2025). Understanding what each dimension means for your business clarifies your measurement priorities.

Citation Frequency is the most basic dimension — how often your brand or content is mentioned in AI answers. This is GEO’s “quantitative metric.” Citation Accuracy checks whether AI cites your information correctly. Being cited with inaccurate information can actually hurt your brand, so this matters just as much as frequency. Citation Context looks at the context of the citation — whether it’s a positive recommendation, a simple listing, or a point of comparison changes its business value considerably.
Citation Competitiveness is your relative position versus competitors for the same question. Your relative standing against competitors gives more useful information for strategy than your absolute citation frequency does. Citation Conversion is the rate at which AI citations translate into actual site visits, leads, and revenue. Ahrefs’ own data showing that AI-search visitors convert at 23x the rate of ordinary search visitors demonstrates the potential of this dimension, and Superlines’ aggregate analysis found citation volume for the same brand can vary by up to 615x across platforms — another data point worth noting. Scoring each of these five dimensions on a 10-point scale gives you a composite AI visibility score out of 50.
How to set up an AI-referral segment in GA4
To measure AI-referred traffic separately from your existing organic traffic, you need to set up a dedicated channel group in GA4. The key is a regex pattern that identifies AI engines’ referrer domains.
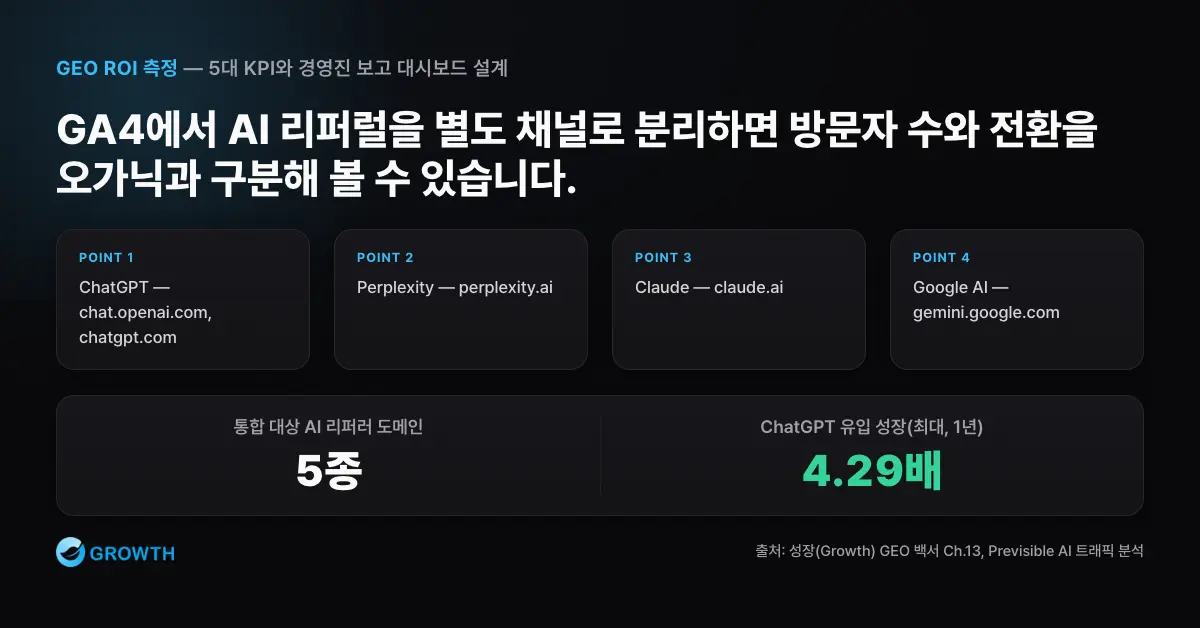
Here are the major AI referrer domains as of now: ChatGPT (chat.openai.com, chatgpt.com), Perplexity (perplexity.ai), Claude (claude.ai), Google AI (gemini.google.com), Bing Copilot (copilot.microsoft.com). Combined into a single regex, this becomes (chat\.openai\.com|chatgpt\.com|perplexity\.ai|claude\.ai|gemini\.google\.com|copilot\.microsoft\.com). In GA4’s admin settings, edit “Channel groups,” add a new “AI Search” channel, and apply this regex to the source condition — AI-referred traffic will then be tallied into its own separate channel.
Once this is set up, you can finally track precisely “how many people visited via AI, and how many of them converted.” You’ll be able to confirm the same trend on your own site that Previsible found in its analysis — that AI traffic accounts for only 0.13% of all sessions, but ChatGPT referrals grew by as much as 4.29x within a single year. Even when the absolute numbers are small early on, tracking the growth slope is what matters.
The HDYHAU survey — quantifying the dark funnel
“How Did You Hear About Us” (HDYHAU) is a survey technique that has become especially important in the AI era. A significant share of customers who first learned of your brand through AI end up arriving by typing your URL directly or searching your brand name — so GA4 records them as “Direct” or “Brand Search” traffic. The fact that AI mediated their awareness leaves no trace in the data. This is exactly the AI Dark Funnel, and the HDYHAU survey is the only tool that can illuminate it.
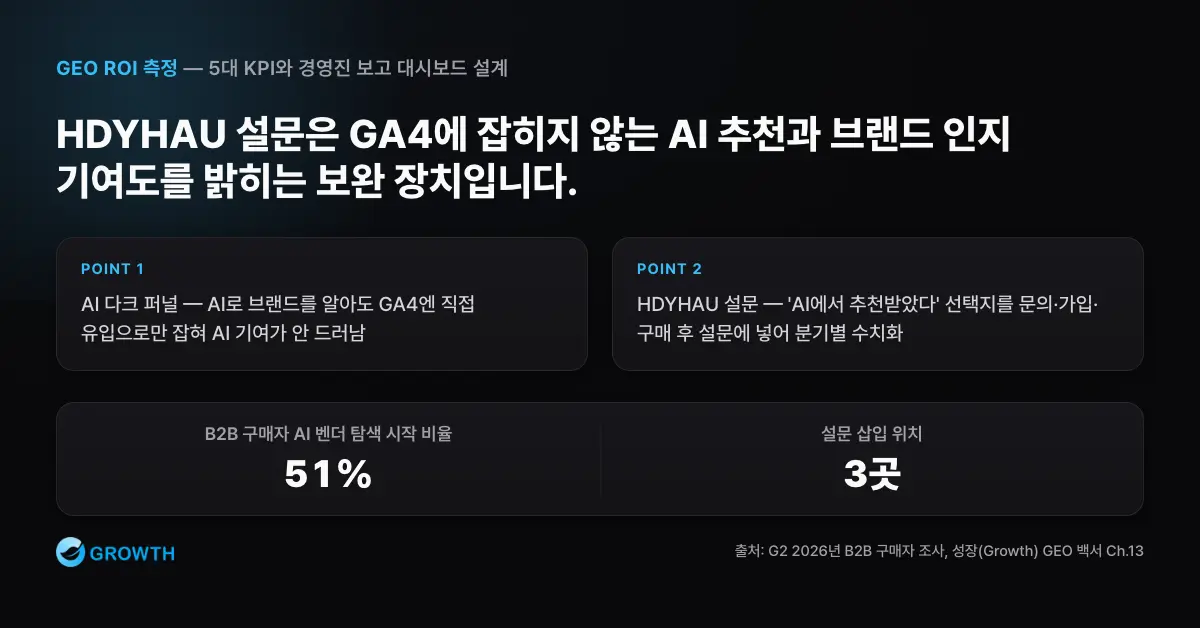
The key to survey design is brevity and specificity. For the question “How did you hear about us?” you need to explicitly include AI-related options like “Recommended by an AI search tool such as ChatGPT or Perplexity” or “The brand was mentioned when I asked an AI a question.” If your only option is a generic “Internet search,” you can’t distinguish AI referrals from Google search referrals. Embed this survey in your contact form, sign-up page, or post-purchase survey, and you can quantify AI awareness contribution every quarter. This is an opportunity to validate G2’s 2026 finding that 51% of B2B buyers start vendor research with AI, using your own first-party data.
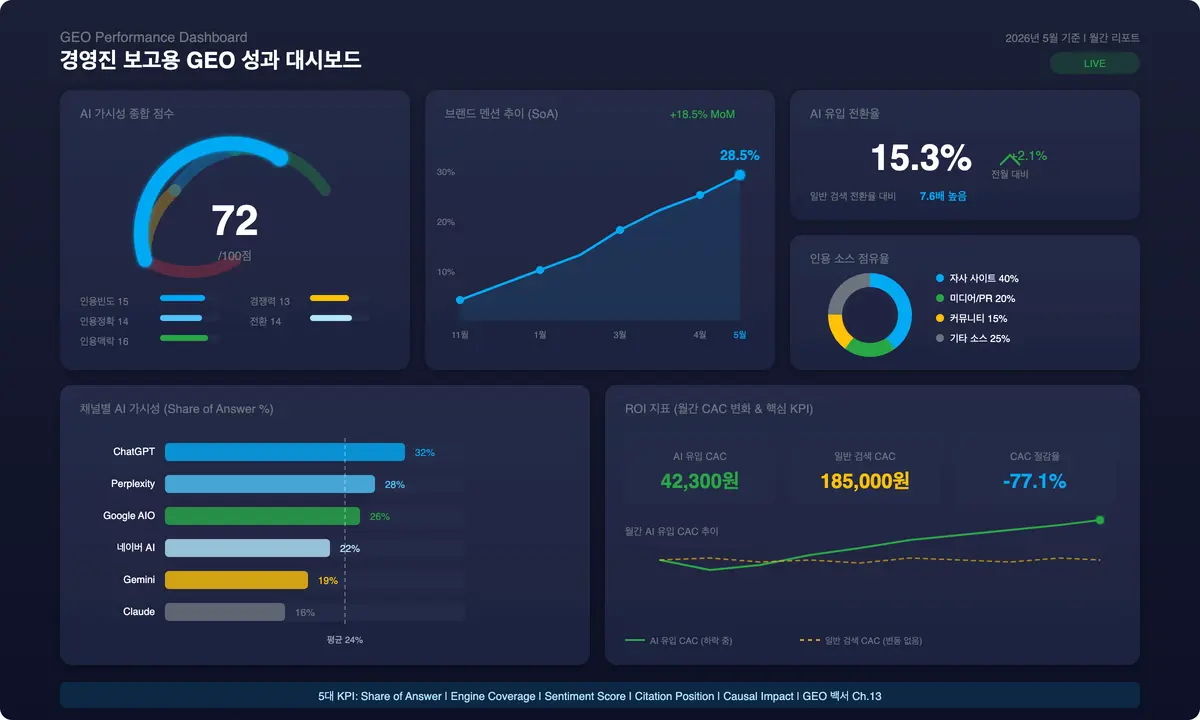
A GEO dashboard for executive reporting
The most common mistake when reporting GEO performance to leadership is “showing too much data.” Executives really only want answers to three questions: “Is it working?” “Where do we stand versus competitors?” and “What’s next?” Design your dashboard to answer exactly these three questions.
The first section is a GEO core metrics summary. Fit the Share of Answer trend (monthly), AI-referred traffic and conversion rate, and HDYHAU survey results onto a single page. The second section is a competitive comparison — visualize your brand’s citation status versus competitors across your 10 core questions. The third section is this month’s key wins + next month’s plan — summarize which content got cited by AI, which activities drove results, and what you plan to do next month, in 3–5 bullet points. Deliver this dashboard once a month, and leadership can grasp GEO’s progress at a glance — and use it as grounds for requesting additional budget or shifting strategy.
For this reporting system to actually work, it presupposes a collaborative structure in which brand marketing, content, PR, and IT all share the same measurement framework. We cover how to divide responsibilities across departments in GEO Organizational Design — A 4-Team Collaboration Model and RACI.
Comparing AI visibility measurement tools
A wide range of AI visibility measurement tools are emerging on the market right now. You need to understand each tool’s characteristics and pick the one that fits your situation.
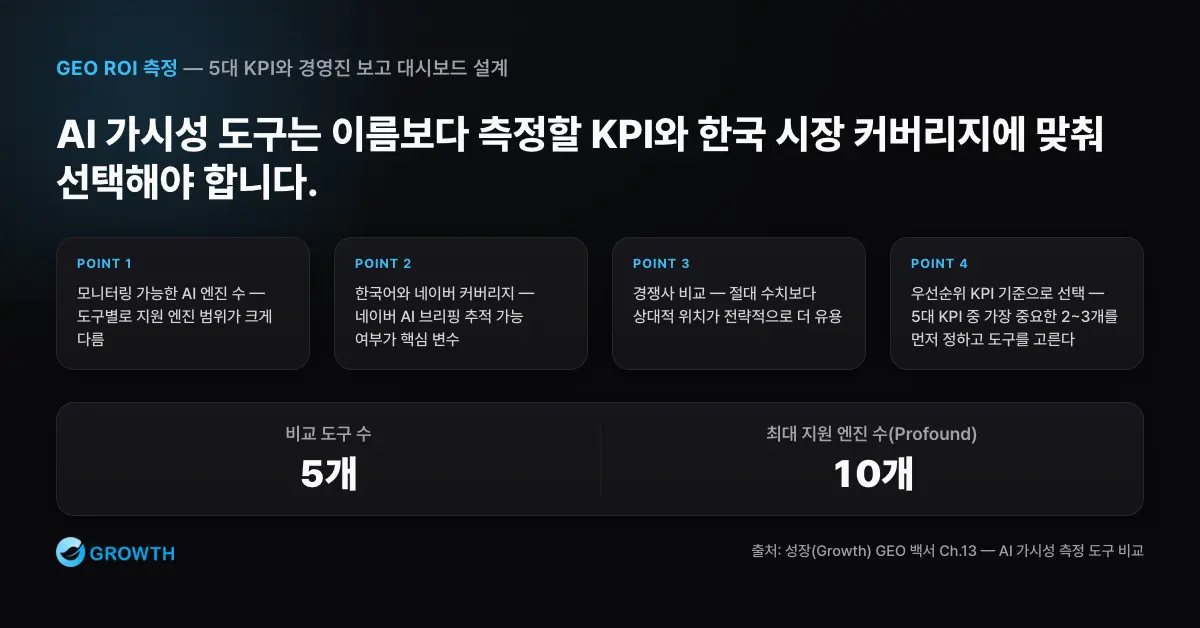
The AI visibility measurement market is still in its early stages, so features and coverage are changing quickly across tools. There are three key evaluation criteria. First, the number of AI engines you can monitor — a tool that only tracks ChatGPT and one that monitors six or more engines simultaneously offer very different value. Second, Korean-language and Naver coverage — for the Korean market, whether a tool can track Naver’s AI Briefing is a critical variable. Third, competitor comparison capability, since relative position carries more strategic meaning than absolute numbers.
| Tool | Key features | Supported engines | Price range |
|---|---|---|---|
| Otterly.AI | Prompt-level SoA tracking, brand mention/citation monitoring, competitor comparison | ChatGPT, Perplexity, Google AIO/AI Mode, Gemini, Copilot | Low–mid |
| Profound | Enterprise-grade AI visibility and citation pattern analysis | 10 engines including ChatGPT, Google AIO/AI Mode, Gemini, Perplexity, Claude, Grok | High |
| Peec AI | Prompt tracking, competitor benchmarking | ChatGPT, Perplexity, Google AIO as base + additional engine options | Mid |
| Semrush (AI module) | Integrates existing SEO data with AI visibility | Google AIO, ChatGPT, and other major engines | High |
| SE Ranking (AI Visibility Tracker) | Tracks brand exposure within AI answers + SEO integration | Focused on ChatGPT, Google AI surfaces | Mid |
One caution: most global tools in the table above don’t include Naver’s AI Briefing in their default coverage, so if the Korean market matters to your business, verify Naver-tracking capability directly before you adopt a tool. And more important than which tool you choose is deciding “what to measure” first. The right order is to pick the 2–3 most important KPIs for your business out of the five core KPIs, then choose the tool that measures those best.
Key Takeaway
- SoA (Share of Answer) is the core GEO KPI — build a 5-metric system alongside Engine Coverage, Sentiment, Citation Position, and Causal Impact
- Setting up a separate AI-referral segment in GA4 lets you precisely track the volume and conversion of AI-referred traffic
- An HDYHAU survey quantifies the AI dark funnel, surfacing AI awareness contribution that GA4 never captures
- Focus your executive dashboard on three things: “is it working,” “where do we stand versus competitors,” and “next action”
Curious how your brand currently shows up in AI answers? Request an AI Answer Share diagnostic. You can also download the full GEO Whitepaper PDF.
Frequently Asked Questions
What’s the core KPI for measuring GEO performance?
Share of Answer (SoA) — the share of AI answers to your industry’s core questions in which your brand is cited. Add Engine Coverage, Sentiment Score, Citation Position, and Causal Impact to that, and you get the full 5-KPI system.
How do you calculate Share of Answer (SoA)?
Select 100 core industry questions, run them across major engines like ChatGPT, Perplexity, Google AIO, and Naver AI, and calculate the share of answers that cite your brand. If your brand is mentioned in 3 out of 10 answers, SoA is 30% — track it monthly to see the trend.
How do you separate AI-referred traffic in GA4?
In GA4’s admin settings, under Channel groups, add a new “AI Search” channel and apply a regex to the source condition that bundles AI referrer domains like chatgpt.com, perplexity.ai, claude.ai, gemini.google.com, and copilot.microsoft.com. AI referrals will then be tallied into their own channel.
How do you measure AI awareness contribution that GA4 doesn’t capture?
Explicitly include AI-search-related options in an HDYHAU (“How did you hear about us?”) survey, and embed it in your contact form, sign-up page, or post-purchase survey. Aggregating this quarterly lets you quantify the AI dark-funnel contribution hidden behind direct traffic and brand search.
GEO Whitepaper series: ← Previous chapter · Full table of contents · Next chapter →