
GEO Budget Planning — Allocation Guide by Company Size and 5 Core Areas
 임재복
임재복
This article is chapter 18 of 20 — Ch.12 Budget Planning — in Growth’s GEO whitepaper series. You can find the full table of contents and the complete PDF on the whitepaper page.
The principle behind GEO (AI engine optimization) budget planning is simple: allocate budget to “results” (AI citation), not “activity volume,” putting 35–40% into Content GEO while reserving 15–20% each for Technical, Off-Page, and monitoring. A realistic monthly budget by company size ranges from the low ₩3 millions to ₩20 million or more. This article walks through budget scenarios by company size, allocation across five core areas, and the most common allocation mistakes.
SEO and GEO: same investment, different harvest
Suppose you invest the same ₩13 million. Put it into traditional SEO, and organic traffic grows, yielding roughly 300 leads at a 2% conversion rate. Put the same amount into GEO, and your brand starts getting cited in AI answers, yielding roughly 50 SQLs (Sales Qualified Leads) at a 15% AI-referral conversion rate. SEO produces six times more leads by count, but by SQL, what GEO produces is high-quality leads whose purchase intent is already validated.
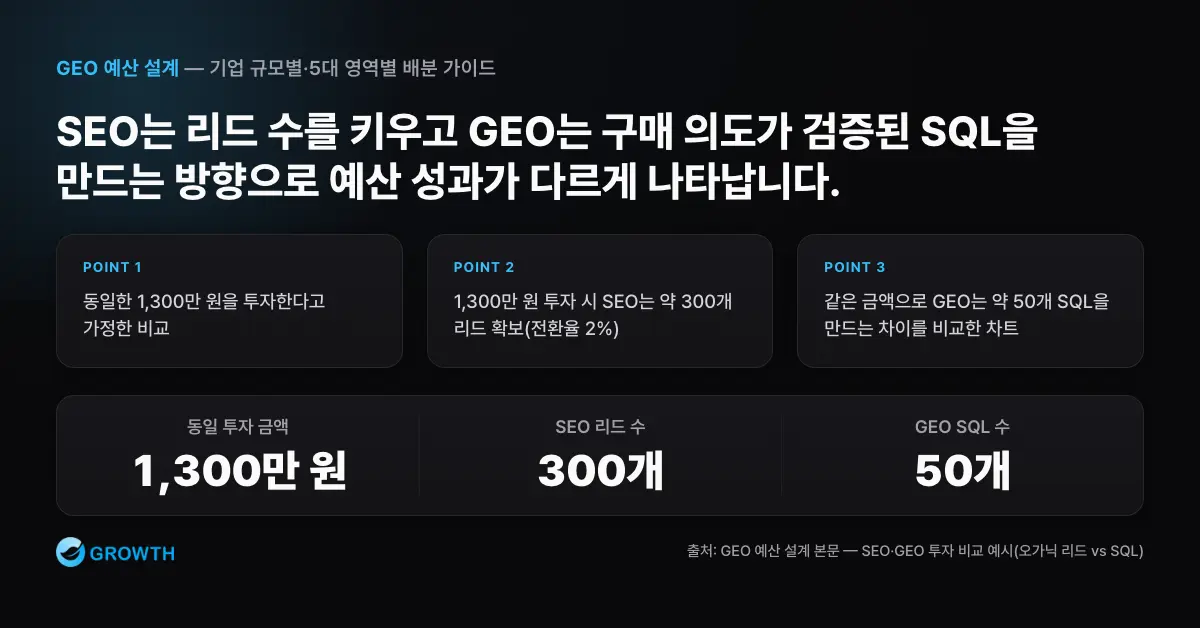
This comparison illustrates the single most important principle in designing a GEO budget: GEO budget should be allocated to “results,” not “activity volume.” Producing 10 pieces of content is activity; a 5-piece increase in AI answer citations is a result. Budgeting around activity easily leads to the trap of “we worked hard, but nothing came of it.” According to Gartner’s 2025 CMO Spend Survey, marketing budgets have plateaued at around 7.7% of revenue, yet only 1% of CMOs said GenAI investment wasn’t a priority — and the follow-up 2026 survey found that an average of 15.3% of marketing budgets are already allocated to AI. With total budgets flat while everyone reallocates toward AI, companies that design that same AI budget around results (AI citation) hold a competitive edge.
Budget scenarios by company size
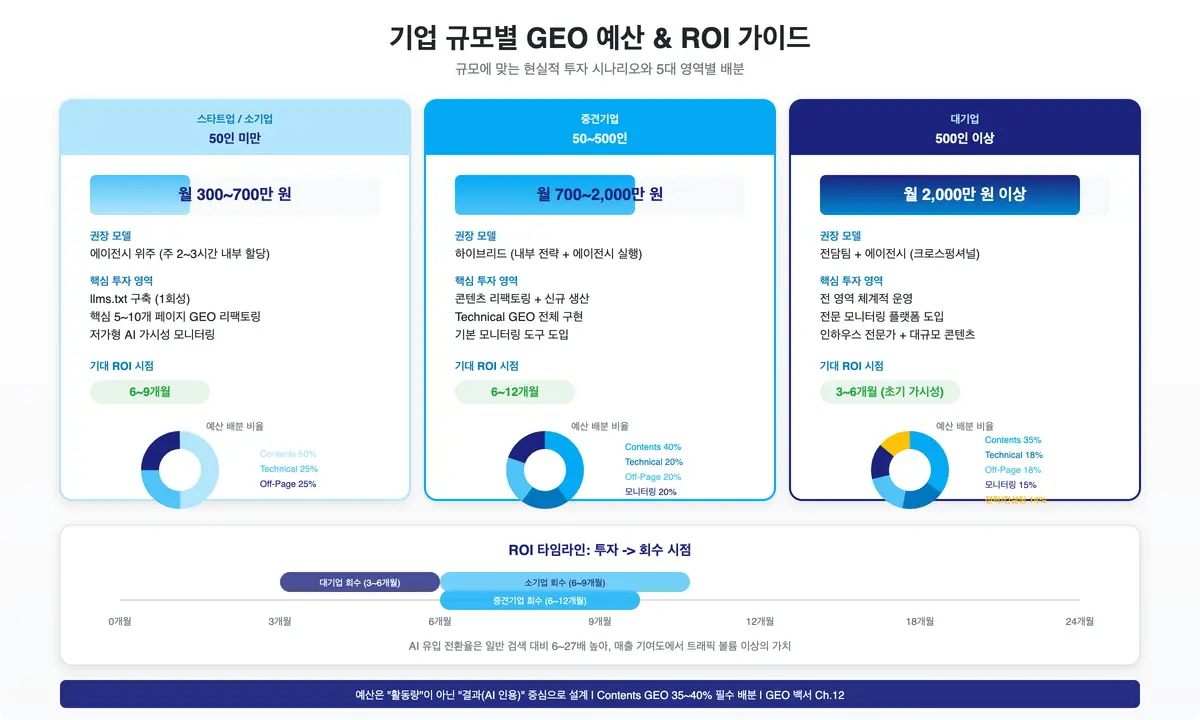
Startups and small businesses (₩3M–₩7M/month): Picture a B2B SaaS startup based in Gangnam, Seoul, with a 2-person marketing team and a total monthly marketing budget of ₩5 million. Advising this company to hire a dedicated GEO staffer or adopt an expensive monitoring tool would be unrealistic. Instead, a realistic approach looks like this: have existing marketing staff dedicate 2–3 hours a week to GEO and focus only on the highest-ROI activities — specifically, a one-time llms.txt build, GEO refactoring of the 5–10 most important pages, and a low-cost AI visibility monitoring tool. According to the OECD’s 2025 report on generative AI among SMEs, 65% of Korean SMEs that adopted generative AI reported new product/service launches and revenue growth — and what characterized Korean SMEs was applying AI to core activities rather than peripheral tasks. The same principle applies to GEO: “start small, but focus on the right places.”
Mid-market companies (₩7M–₩20M/month): Picture a B2B manufacturer with ₩50 billion in revenue, with one SEO staffer on the marketing team and a budget for outsourced content. At this scale, it’s reasonable to reallocate 30–40% of your existing SEO budget toward GEO. Adopt a hybrid model with an agency: keep strategy-setting and monitoring in-house, and outsource content refactoring and Technical implementation to the agency (we cover agency selection criteria and vetting questions in our GEO agency selection guide). A realistic timeline is establishing an AI citation baseline within 6 months and formally evaluating ROI at the 12-month mark. According to IDC, global AI solution investment reached $307 billion in 2025, with a projected cumulative economic impact of $22.3 trillion by 2030 — so for mid-market companies, GEO investment is very much about securing future competitiveness.
Large enterprises (₩20M+/month): BCG’s 2025 survey found that 71% of CMOs plan to invest $10 million or more (roughly ₩13 billion) annually in GenAI over the next three years — that’s enterprise-scale territory. Companies at this scale can build a dedicated-team or cross-functional organizational model, as discussed in designing your GEO organization, and run a systematic GEO program. A significant share of the budget goes to people (in-house experts plus an agency), tools (AI visibility monitoring platforms, content management systems), and content production. The most common mistake in enterprise GEO investment is “overinvesting in tools and underinvesting in content.” No matter how good your monitoring tool is, if you don’t have quality content for AI to cite, there’s nothing to monitor.
| Company size | Monthly GEO budget | Recommended model | Core investment area | Expected ROI timeline |
|---|---|---|---|---|
| Startups/small business | ₩3M–₩7M | Agency-led | llms.txt, core content refactoring | 6–9 months |
| Mid-market | ₩7M–₩20M | Hybrid | Content + Technical + basic monitoring | 6–12 months |
| Enterprise | ₩20M+ | Dedicated team + agency | Systematic operation across all areas | 3–6 months (initial visibility) |
Budget allocation across five core areas
Managing your GEO budget as a single lump makes it hard to tell where money went and which area is producing results. Splitting it across five areas lets you manage investment efficiency.
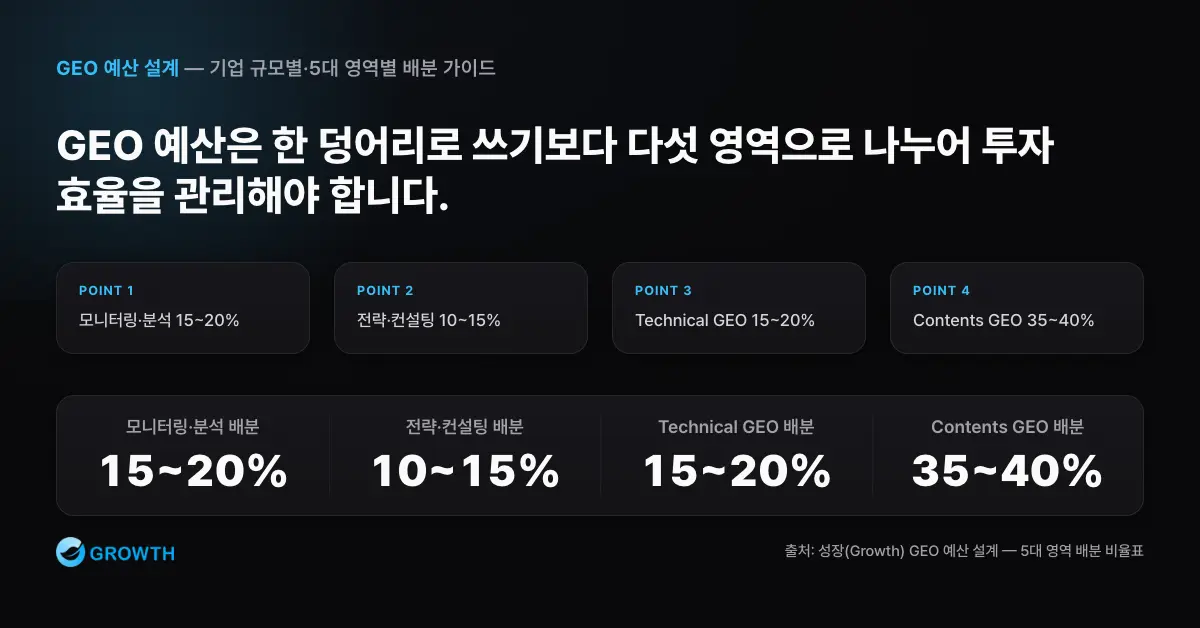
Monitoring and analysis (15–20%): This is GEO’s “eyes.” It covers AI visibility measurement tool subscriptions, GA4 setup and management, and competitor benchmarking analysis. Running GEO without monitoring is like flying a plane without instruments. That said, spending more than 30% of your budget on monitoring is overinvestment — results come from doing, not just watching.
Strategy and consulting (10–15%): This is GEO’s “brain.” It covers strategy development, roadmap design, regular strategy reviews, and outside expert consulting when needed. This share can run higher in the first 6 months, and gradually shrinks as in-house capability matures.
Technical GEO (15–20%): This is GEO’s “infrastructure.” It covers building and maintaining llms.txt, schema markup, crawler policy configuration, and site performance optimization. Initial investment is concentrated up front, then the share drops to a maintenance level afterward.
Content GEO (35–40%): This is GEO’s “fuel,” and the area that should hold the largest share. It goes toward producing quality content AI can cite, refactoring existing content, and developing multimodal content (video, infographics, etc.). AI ultimately cites good content. Focusing on every other area while skipping investment in content is like building the chassis with no engine.
Off-Page GEO (15–20%): This is GEO’s “diplomacy.” It covers digital PR, earning community mentions, review management, and media partnerships. Off-page activity has strong synergy with Content GEO, so running the two areas in tandem raises overall efficiency.
| Area | Allocation | Role | Performance metric |
|---|---|---|---|
| Monitoring and analysis | 15–20% | GEO’s eyes | Measurement accuracy, report coverage |
| Strategy and consulting | 10–15% | GEO’s brain | Strategy hit rate, roadmap execution rate |
| Technical GEO | 15–20% | GEO’s infrastructure | Crawl access rate, schema implementation rate |
| Content GEO | 35–40% | GEO’s fuel | AI citation count, content quality score |
| Off-Page GEO | 15–20% | GEO’s diplomacy | Mention count, growth in external citations |
Prioritizing by customer journey stage
When budget is limited, you need to decide which stage of the customer journey to concentrate GEO resources on. The highest-ROI point is where “high-purchase-intent questions” occur in AI. For example, “B2B marketing agency recommendation” is a question asked by someone already looking for an agency, so if your brand gets cited in the AI answer to this question, it directly contributes to business outcomes. By contrast, “what is B2B marketing” is a question asked by someone still in the learning stage — it contributes to awareness, but contributes little to short-term conversion. If your initial budget is limited, it makes sense to target questions closer to conversion first, then expand to the awareness stage as budget grows.
Plan A vs. Plan B — two investment scenarios
Plan A: 4-month intensive investment. This is an aggressive approach that compresses the 90-day roadmap to set up every area within 4 months. Increase your monthly budget to 1.5–2x normal, and lean heavily on an agency to move faster. This fits situations where a competitor has already started GEO, or where AI search adoption is moving fast in your industry and first-mover advantage is urgent. The risk is that upfront costs run high, and the pace can outstrip what your internal team can absorb.
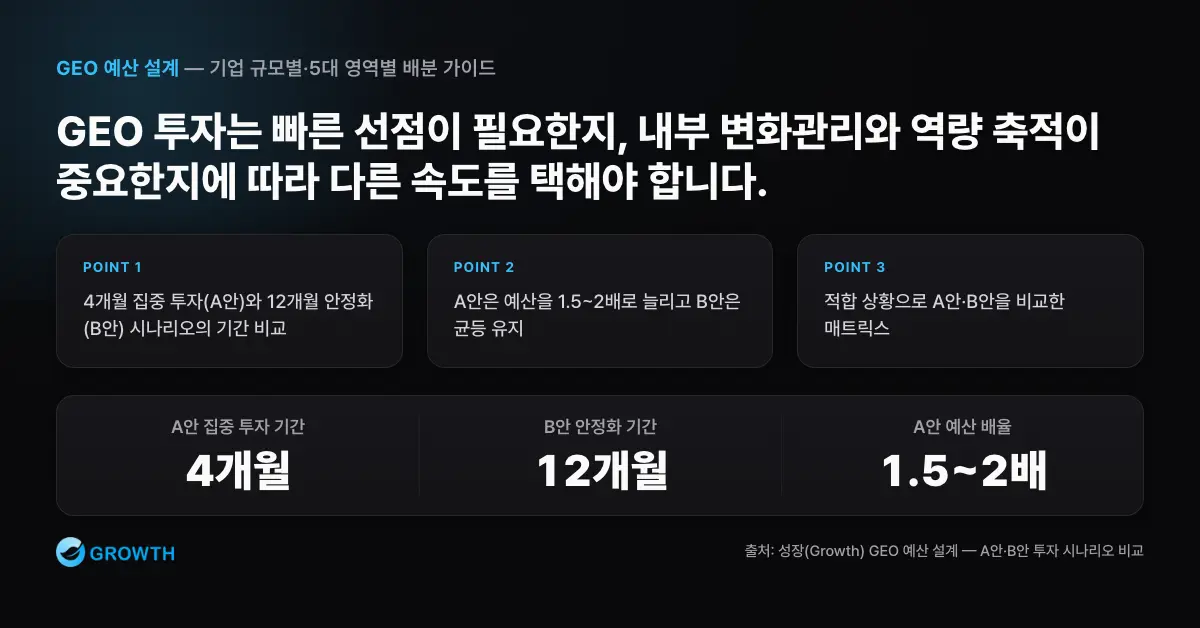
Plan B: 12-month stabilization. This is a conservative approach that expands gradually over the 8–9 months following the 90-day roadmap. Keep your monthly budget even, build in-house capability, and validate results at each stage before moving to the next. This fits situations where GEO is still early in your industry, or where internal change management needs time. The risk is potentially ceding the first-mover opportunity to competitors.
Whichever plan you choose, in a landscape where McKinsey projects $463 billion a year in marketing productivity gains, AI search visibility investment is one of the areas most directly connected to capturing that benefit. The question isn’t whether to invest — it’s the pace and method of investment.
Top 3 budget allocation mistakes
Here are three budget allocation mistakes that show up repeatedly in the field. Simply being aware of them meaningfully improves investment efficiency.
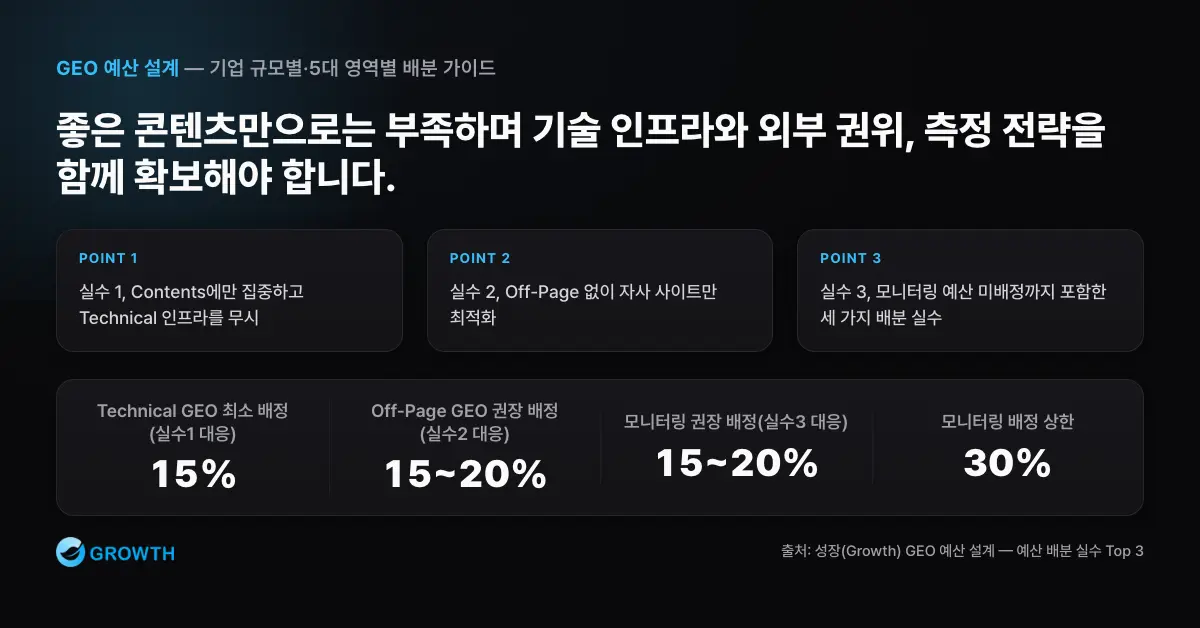
Mistake 1: Focusing only on Content and ignoring Technical. This pattern shows up as mass-producing quality content while allocating no budget to technical infrastructure like llms.txt, schema markup, and AI crawler configuration. It’s like buying a luxury car with no road to drive it on. If an AI crawler can’t collect your content, no amount of quality gets it into AI’s field of view. Allocate at least 15% of your total budget to Technical GEO up front.
Mistake 2: Optimizing only your own site, with no Off-Page work. This pattern concentrates budget entirely on-site, with no investment in earning brand mentions on external platforms. As we covered in Off-Page GEO, a substantial share of AI citations come from external earned media — news, reviews, communities. No matter how perfect your own site is, if your brand isn’t mentioned externally, it fails AI’s cross-verification step. Consistently allocate 15–20% to Off-Page GEO.
Mistake 3: No budget allocated to monitoring. This pattern invests in content and technical work while allocating no budget to the tools and processes that measure results. Without knowing “what’s working and what isn’t,” you have no basis for next quarter’s budget allocation. Allocate 15–20% to monitoring, but keep it balanced and don’t let it exceed 30% — results come from doing, not just watching.
Key Takeaway
- Design your GEO budget around “results” (AI citation), not “activity volume”
- Allocate 35–40% to Content GEO, while securing 15–20% each for Technical and Off-Page
- Realistic scenarios by company size: small business (₩3M–₩7M/month), mid-market (₩7M–₩20M/month), enterprise (₩20M+/month)
- Targeting high-purchase-intent questions in the customer journey first maximizes early ROI
If you’re curious how your brand currently shows up in AI answers, get in touch about an AI answer share diagnosis. You can also request the full GEO whitepaper PDF.
Frequently asked questions (FAQ)
What’s the minimum monthly budget to start GEO?
Startups and small businesses can start at around ₩3M–₩7M a month. At this stage, the key is focusing only on the highest-ROI activities — an llms.txt build, GEO refactoring of the 5–10 most important pages, and low-cost AI visibility monitoring.
Which area should get the biggest share of a GEO budget?
Content GEO. We recommend 35–40% of your total budget, because AI ultimately cites quality content worth citing. That said, you should keep 15–20% each for Technical GEO, Off-Page GEO, and monitoring/analysis to stay balanced.
Should GEO budget be separate from existing SEO budget?
For a mid-market company, reallocating 30–40% of your existing SEO budget toward GEO is realistic. SEO and GEO share a substantial amount of technical foundation and content assets, so this is less a fully separate budget and more a reallocation that tracks a separate result metric (AI citation).
How long does it take to see GEO results?
It varies by scale and approach, but realistic timelines are 6–9 months for small businesses, 6–12 months for mid-market companies, and 3–6 months for initial visibility at enterprises with a dedicated program. A 4-month intensive investment (Plan A) prioritizes speed, while 12-month stabilization (Plan B) prioritizes risk management.
GEO whitepaper series: ← Previous chapter · Full table of contents · Next chapter →