
The Complete Guide to B2B Marketing — Strategy, Channels, ABM, Lead Generation, and Measurement
 임재복
임재복
B2B marketing is the discipline of designing the entire pre-purchase journey — from communicating a product or service’s value to another company, through evaluation, adoption, contracting, and expansion. Even when B2B uses the same tools as B2C — ads, content, email — the fact that an average of 6-10 people on a buying committee make the decision over several months means the entire strategy, organization, and measurement approach has to be designed separately. The core isn’t increasing traffic volume — it’s delivering exactly the information the one decision-maker who becomes revenue needs, at each stage of their purchase journey.
Because the purchase decision structure, deal size, number of decision-makers, and pipeline length are fundamentally different from B2C, importing the B2C playbook wholesale mostly doesn’t work. This article is a pillar guide for anyone from a marketer systematizing B2B marketing for the first time to a practitioner already running campaigns who wants to revisit higher-level concepts like ABM, PLG, and alignment. Each section is written to stand on its own, and links to deeper internal articles where relevant.
This guide doesn’t lean on any given year’s market conditions — it focuses on laying out the principles, frameworks, and measurement systems that form the skeleton of B2B marketing. Year-specific trends, benchmarks, and tool comparisons get updated in separate cluster articles. So this article’s structure is designed to be established once and hold up for years. Use it as onboarding material when your organization first adopts B2B marketing, as a resource for newly joined marketers, or as a milestone for reviewing your annual strategy.
1. What Is B2B Marketing? — Structural Differences From B2C
B2B marketing refers to every activity aimed at delivering a product or service’s value to a business customer, guiding them through consideration, evaluation, and adoption to a signed contract, and then sustaining a long-term relationship. This includes brand awareness building, content marketing, lead generation, lead nurturing, sales enablement, customer success, retention, and expansion sales. What matters is that all of these activities are connected within a single pipeline. A single ad or a single blog post rarely delivers results on its own — instead, it contributes to a specific stage of the pipeline.
The biggest difference from B2C is the unit of decision-making. In B2C, one consumer decides to buy within minutes or days. In B2B, a buying committee averaging 6-10 people reaches a final decision over 3-12 months, sometimes longer, working through proposals, demos, comparisons, internal approvals, legal review, and contract negotiation (Gartner, B2B Buying Journey). Deal size differs too — while B2C ranges from tens to a few million won, B2B spans from a few million to several billion won. This difference shapes marketing messaging, channel selection, content depth, lead scoring, and the entire structure of sales collaboration.
Another fundamental difference is the balance between emotion and logic. B2C responds strongly to desire, lifestyle, identity, and instant gratification. Emotion doesn’t disappear entirely in B2B, but the logical grounds for the purchase decision — cost savings, productivity gains, risk reduction, regulatory compliance, ROI — always have to be present. The finance, legal, IT, and security people on the buying committee won’t be swayed by emotional messaging alone. At the same time, practitioners and executives are staking their own reputation and career on the choice, so emotional reassurance (a trustworthy partner, a choice that won’t fail) is essential too. In the end, B2B has to balance emotion and logic with extreme precision.
Channel preference differs as well. Where B2C leans on mass media — TV, YouTube, Instagram, TikTok — B2B weights heavily toward narrow, deep channels: search, LinkedIn, email, webinars, trade media, and industry communities. Judged purely on ad efficiency, B2B costs far more per unit, but because a single conversion carries a much higher revenue contribution, the LTV-to-CAC math still works. Traditional offline trade shows and conferences also still function as important lead sources. In short, B2B marketing is a game of digging deep into a narrow market.
| Comparison | B2B | B2C |
|---|---|---|
| Number of decision-makers | Buying committee averaging 6-10 (Gartner) | 1 person or a household |
| Purchase cycle | 3-12 months, sometimes 18+ months | Minutes to days, at most a few weeks |
| Average deal size | A few million to several billion won | Tens of thousands to a few million won |
| Core motivation | Cost savings, productivity, ROI, risk management | Desire, lifestyle, instant gratification |
| Emotion vs. logic | Logical grounds (ROI, risk) come first, emotion supports through trust | Emotion and desire lead, logic tends to be post-hoc rationalization |
| Main channels | Search, LinkedIn, email, webinars, trade shows | TV, YouTube, Instagram, TikTok, retail |
| Content formats | Whitepapers, case studies, long-form guides, calculators | Short-form video, memes, challenges, live commerce |
| Success metrics | Pipeline contribution, SQL, win rate, NRR | Sales volume, CTR, ROAS, retention |
| Lead-to-conversion rhythm | Multi-month lead nurturing | Same-day or same-week campaign conversion |
| Weight of the sales organization | Equal to or greater than marketing | Performance marketing drives conversion |
Fail to understand these structural differences, and transplanting the B2C playbook straight into B2B mostly fails. Build ad creative as “eye-catching image + short copy + promo code,” for instance, and it won’t pass the B2B buying committee’s review criteria. On the other hand, material that’s too technical and too long causes an early-stage practitioner to bounce without reading. The starting point of B2B marketing is precisely designing “who needs what information, when” based on the purchase journey. B2B vs. B2C Marketing
2. The B2B Buyer Journey and Decision Structure — Gartner’s Six-Stage Model
The standard framework for the B2B buyer journey is Gartner’s six-stage model. While traditional three-stage models like “awareness-consideration-purchase” oversimplify the actual B2B process, Gartner’s model reflects the nonlinear loop a buying committee actually goes through. The six stages are Problem Identification, Solution Exploration, Requirements Building, Supplier Selection, Validation, and Consensus Creation. Real buyers don’t move through these stages in order. They loop back to a stage multiple times, several stages run in parallel, and different committee members sit at different stages simultaneously. According to the same Gartner research, the time a buying group spends meeting directly with prospective suppliers accounts for only 17% of the entire purchase journey. For the rest of the time, buyers research on their own and build internal consensus — which means covering that stretch sales can’t reach is content and marketing’s job.
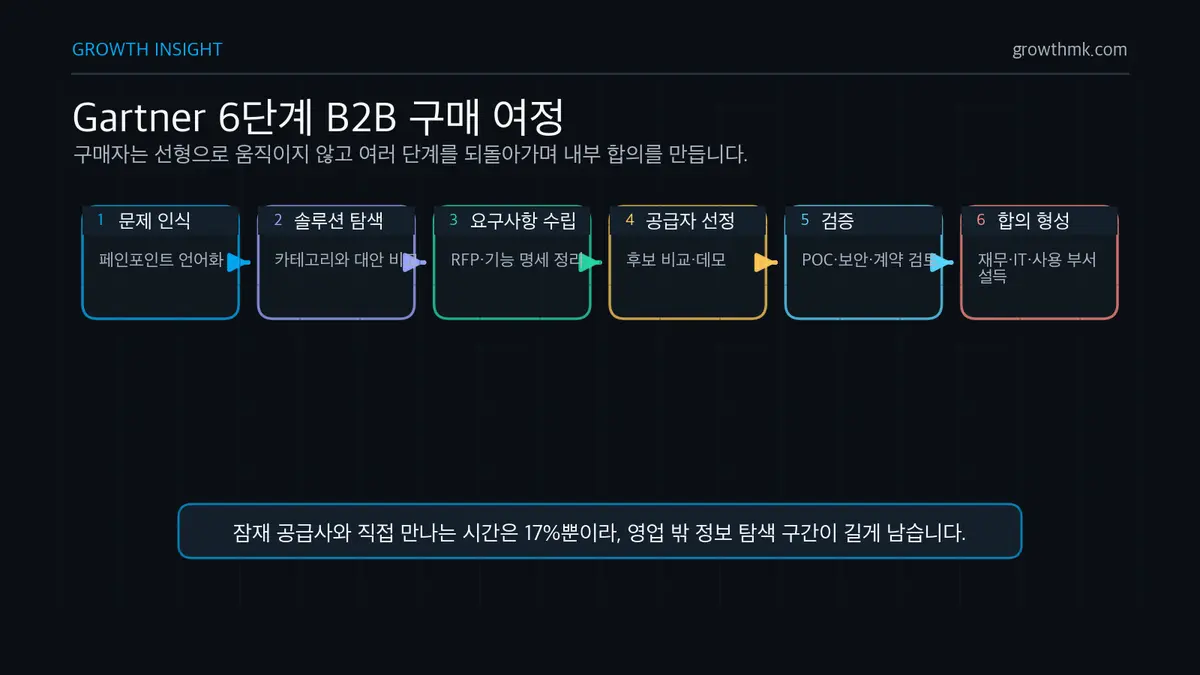
At the problem identification stage, the organization hasn’t yet clearly defined its own pain point. Revenue has stalled, costs are rising, or they feel like they’re losing ground to competitors — but the specific cause is still unclear. At this stage, buyers seek out industry trend articles, sector reports, and benchmark data. The way a marketer contributes here is by providing content that puts the pain point into words. Rather than plain product advertising, content that interprets an industry issue — “3 signs your revenue is stalling,” “the structural causes behind falling inventory turnover” — is effective.
From the solution exploration stage on, the buyer starts thinking about what kind of solution they want. They work out “do we need a CRM, marketing automation, or a CDP.” At this stage, category definition, solution-type comparisons, and adoption success stories play an important role. The requirements building stage is when the feature specs going into an RFP get finalized. Here, the best material a marketer can offer is a structured guide — a “buyer’s checklist,” a “feature comparison chart,” “10 questions to check before adopting.”
From supplier selection on, the sales organization gets fully involved. Demos, technical validation, reference calls, and detailed quotes go back and forth. The validation stage is where POCs, pilots, security review, and contract negotiation continue. Marketing’s role may look diminished at this stage, but in practice you still need to support sales with case studies, ROI calculators, reference customer introductions, and security documentation. The consensus creation stage is where internal persuasion within the buying committee happens. When finance objects, IT raises security concerns, or the using department resists change, you need material that overcomes it.
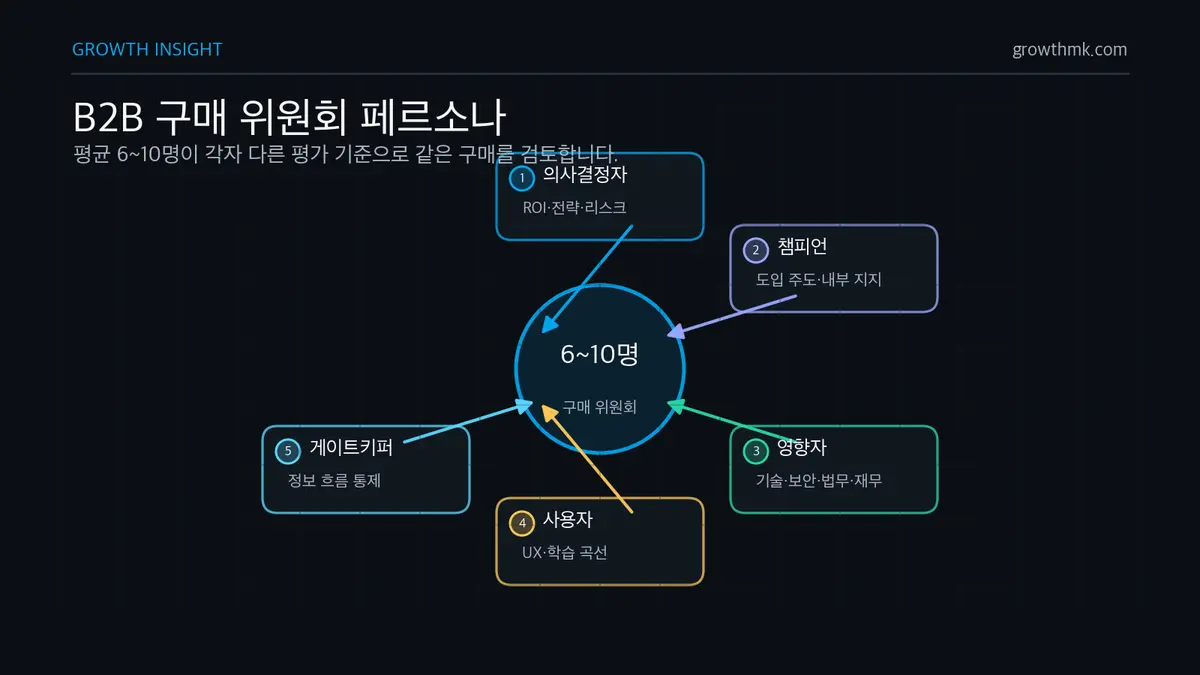
A buying committee means more than “several people decide” — it’s a group of personas, each with different evaluation criteria and motivations. There are five representative personas. First, the decision maker: the executive or C-level with final approval authority, focused on ROI, strategic fit, and risk. Second, the champion: an internal advocate actively driving adoption — a working-level owner who wants to build their career on the outcome of solving this problem. Third, the influencer: technical, security, legal, or finance experts who can exercise a veto in their specific domain. Fourth, the user: the frontline employee who will actually use the product, focused on UX, learning curve, and fit with their work. Fifth, the gatekeeper: an assistant, procurement staffer, or security team member outside or below the committee who controls the flow of information.
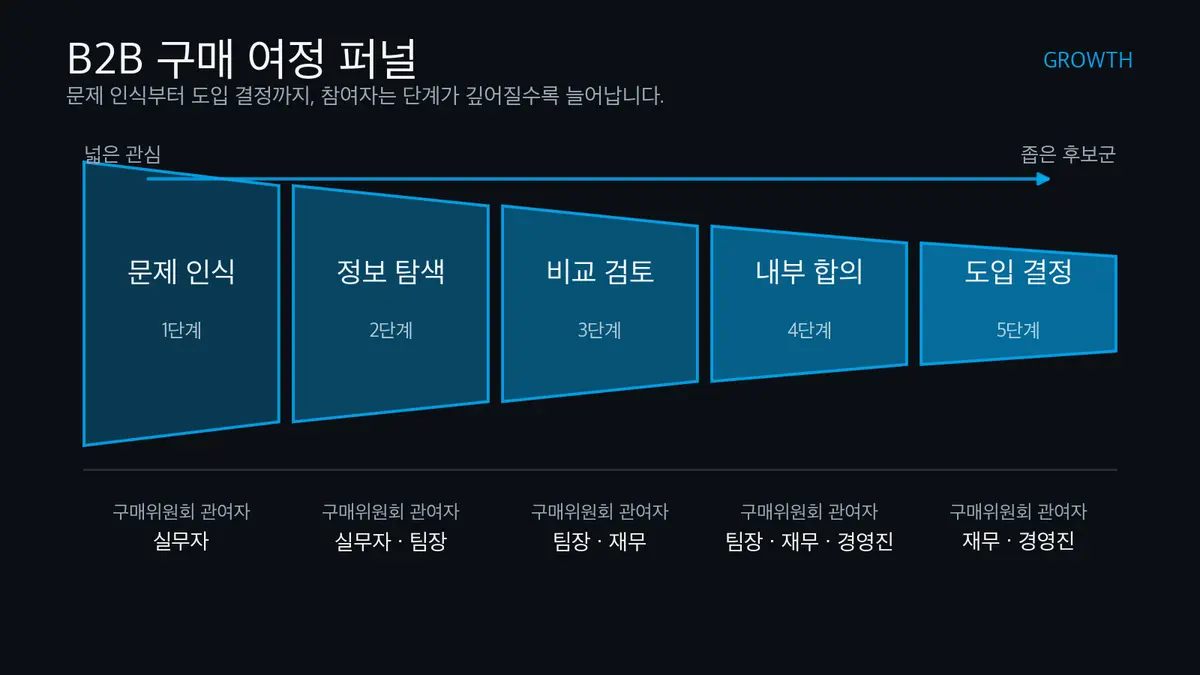
Each persona needs different content at each stage of the journey. The champion is most active at the problem identification and solution exploration stages, playing the role of a partner who shares internal context with sales. The decision maker gets heavily involved in the latter half of validation and at consensus creation. Influencers, users, and gatekeepers each demand scenario-specific documentation at the validation stage. Ultimately, B2B marketing content has to be structured as a “journey stage × persona” matrix. Branch the same case study into a champion version (results-focused), a decision-maker version (ROI summary), and an influencer version (deep security/technical detail), and conversion rates rise significantly. The Customer Decision Journey
A mistake marketers commonly make when designing content strategy by buyer journey stage is cramming every piece of content toward “final conversion.” Slap a demo-request CTA on early-stage content without thinking, and instead of converting, you just drive people away. Instead, you need to design an appropriate micro-conversion for each stage. Early on, “download the guide,” “subscribe to the newsletter,” and “use the calculator” fit well. In the middle, “register for the webinar,” “request the comparison chart,” and “take the self-assessment” are effective. Later, “request a demo,” “1:1 consulting,” and “apply for a POC” become the real lead-conversion points. Only when you distribute CTAs this way across stages does the whole pipeline flow in a healthy way.
3. Strategy by B2B Marketing Channel — Organic, Email, LinkedIn, Events, Paid, PR
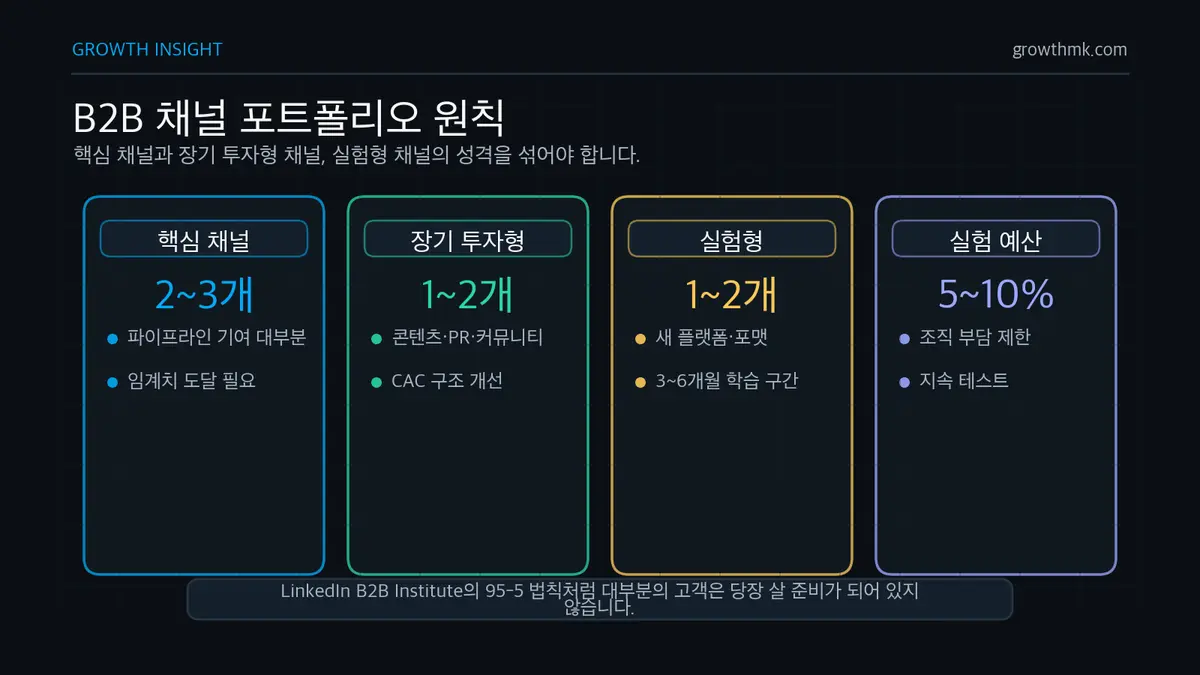
B2B marketing channels break down into six broad areas. Each channel fits differently with a specific stage of the buyer journey, and differs in resource requirements, scalability, and response speed. Try to run every channel simultaneously and the budget gets so spread out that none of them ever crosses critical mass. Go all-in on a single channel instead, and you become vulnerable to channel risk and rising CAC. The typical approach is to build a portfolio of 2-3 core channels responsible for most of your pipeline contribution, 1-2 long-term investment channels, and 1-2 experimental channels.
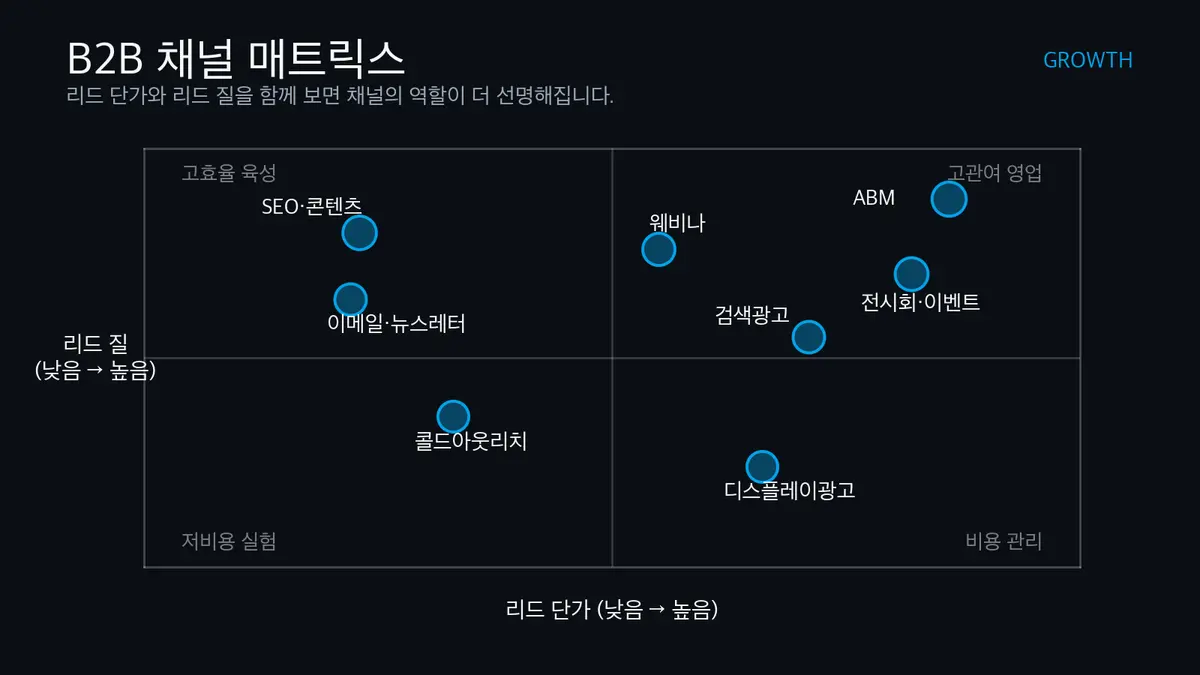
First, organic content marketing is the channel that leaves the most powerful long-term asset. This includes SEO-driven blogs, guides, long-form whitepapers, case studies, and industry reports. Traffic is minimal at first, but accumulate it for 6-12 months and compounding effects turn it into a primary lead source. The key is picking topics matched to “search intent” through keyword research. Chase only traffic keywords and conversion suffers; chase only conversion keywords and reach narrows. A two-layer structure — a pillar page dominating a top-level topic, with cluster articles solving practitioner-level problems — works well. This article itself is the pillar of exactly that structure.
Second, email marketing and newsletters are a primary channel for nurturing organically acquired leads over the long haul. In B2B, a newsletter isn’t merely a “promotional tool” — it functions as a content platform that delivers thought leadership. Send industry interpretation, your own perspective, and practical tips weekly or biweekly, and subscribers gradually come to trust the brand. A drip campaign is an email sequence that automatically branches based on a lead’s topic interest and stage, automating lead nurturing at scale. As a benchmark, Mailchimp’s email marketing benchmarks, aggregated from its own send data, report an all-industry average open rate of 35.63% and click rate of 2.62% (as of December 2023). That said, since mail client privacy features tend to inflate open-rate figures, and results vary by industry, list quality, and tone, it’s safer to interpret this with a click- and conversion-contribution focus. We’ve verified with data how a newsletter actually drives revenue in Does a B2B Newsletter Really Drive Revenue? Email Marketing Strategy
Third, LinkedIn and industry communities are nearly the only place social media actually works in B2B. LinkedIn means building up thought-leadership posts through employees’ personal accounts, and publishing product and official content through the company page. When comment networking combines with DM outreach, the line between inbound and outbound blurs. In Korea, beyond LinkedIn, industry-specific communities (developer Discord servers, marketer Slack groups, industry association forums) become important sources of insight and leads. Approach a community as a place to “give and receive help” rather than a promotional space, and it becomes a long-term asset.
Fourth, events and webinars are a classic powerhouse for B2B lead generation. This spans offline trade shows, industry conferences, your own user conference, roundtables, small VIP dinners, and webinars, which are the digital transformation of all of these. Webinars are an excellent format for mid-stage lead nurturing, since they cover a deep topic for 45-60 minutes while letting you interact with the audience through Q&A. The key is designing the full funnel — invite, run, record, repurpose. Gather registrations through email, ads, and partner collaboration; capture chat questions during the session to feed into lead scoring; and turn the recording into on-demand content that keeps absorbing leads continuously.
Fifth, paid advertising centers on search ads and LinkedIn Ads. Search ads deliver the best ROI when focused on high-purchase-intent, bottom-funnel keywords — category names, competitor names, “review,” “pricing,” “comparison.” LinkedIn Ads’ strength is precise targeting by job function, industry, and company size, but given its high cost, it’s mostly used for account reach in ABM campaigns and distributing long-form content. Display and YouTube ads are valid at the awareness stage even in B2B, but they suit remarketing and brand reinforcement more than expecting direct conversion. Ad channels always need to be paired with an organic asset (a content hub) — you never want a structure where leads evaporate the moment you turn off ads. We cover the pattern behind why paid channels structurally fail, and how to overcome it, in depth in The Complete Guide to Performance Marketing.
Sixth, PR and analyst relations are a high-impact but long-horizon investment where instant results are hard to expect. This includes bylines in trade publications, press releases, awards, media interviews, and getting listed in analyst reports from firms like Gartner or Forrester. Especially in enterprise deals, an analyst report acts as “social proof” for the buying committee. Send out press releases regularly, timed to product launches, partnerships, awards, and funding rounds — but pair that with actually building relationships with journalists, not just distribution.
| Channel | Resource requirement | Time to reach critical mass | Best-fit stage | Core metric |
|---|---|---|---|---|
| Organic content | Medium (content production) | 6-12 months | Problem identification, solution exploration | Organic sessions, MQL count, keyword rankings |
| Email/newsletter | Low to medium | 3-6 months | Solution exploration, requirements, nurturing | Open rate, CTR, conversion contribution |
| LinkedIn/community | Medium (ongoing operation) | 6-9 months | Awareness, thought leadership | Engagement, DM conversations, leads |
| Events/webinars | High | Immediate (per event) | Requirements, validation | Registrations, attendance rate, SQL |
| Paid ads | High (budget) | 1-3 months | Solution exploration, supplier selection | CPL, CPA, ROAS, pipeline |
| PR/analysts | Medium to high | 12+ months | Every stage (social proof) | Feature count, search volume, analyst rating |
The best starting point for deciding your channel mix is tracing back “the source of every deal closed in the past 12 months.” Confirming which channel produced the first touch, where the MQL-to-SQL conversion happened, and which channel combination produced the final contract gives you real grounds for next quarter’s budget allocation. Even if multi-touch attribution isn’t perfect, simply recording first touch, last touch, and the major touches in between is more than enough to inform a decision. How to Choose Marketing Channels
Two traps to watch for when designing a channel portfolio. First, the mistake of cutting organic content investment because short-term metrics look good elsewhere. Organic takes a long time to cross critical mass, and ROI looks weak in the meantime, but once it crosses that threshold, it structurally lowers CAC. LinkedIn B2B Institute’s 95-5 rule supports this logic — 95% of prospective buyers aren’t in the market to buy right now, so short-term-conversion channels alone can’t capture future demand. Conversely, paid channels stop the moment you turn them off. Confuse these two investment characters, and budget discussions get distorted. Second, the mistake of pinning outsized organizational expectations on a “new channel.” A new platform normally shows low ROI during its 3-6 month learning window, and shutting down the experiment during that period means you don’t even get to keep the data. Design experimental channels to stay within 5-10% of the total budget, so you can keep testing without much pressure.
A quick note on creative principles by channel. Search ads need to run alongside a landing page that precisely answers the “search intent” of the keyword. For LinkedIn Ads, “who’s speaking” matters as much as job/industry targeting — sponsored content from an executive’s or expert’s personal account often outperforms a company page ad. For email, the subject line decides the open, and the first line decides the click. A structure that puts a “common industry problem” in the subject and mentions that problem’s concrete cost in the first line of the body performs reliably well. For webinars, satisfaction and lead quality both rise the more you minimize promotional slides and center the session on “real-world examples and concrete numbers.”
4. ABM (Account-Based Marketing) — A Target-Account-Centric Strategy
ABM is a methodology that shifts the paradigm from “marketing to everyone” to “marketing to high-value accounts.” Where mass marketing casts a wide net to collect leads, ABM concentrates resources entirely on a predefined account list. Early-stage startups grow on inbound alone, but as the enterprise deal share grows, a target emerges — “these specific 100 companies,” “these 20 industries,” “these large conglomerate groups.” ABM works powerfully once a target this clear exists.
ABM’s first step is selecting target accounts. The most widely used framework is TAM-SAM-SOM. TAM (Total Addressable Market) is the theoretical entire market. SAM (Serviceable Available Market) is the market you can actually reach with your product or service, and SOM (Serviceable Obtainable Market) is the market you can actually capture with your current resources. Within SOM, ABM narrows further to accounts “where we can deliver the most value and close the fastest.” It combines criteria like industry, revenue size, headcount, tech stack, region, and recent funding or leadership changes.
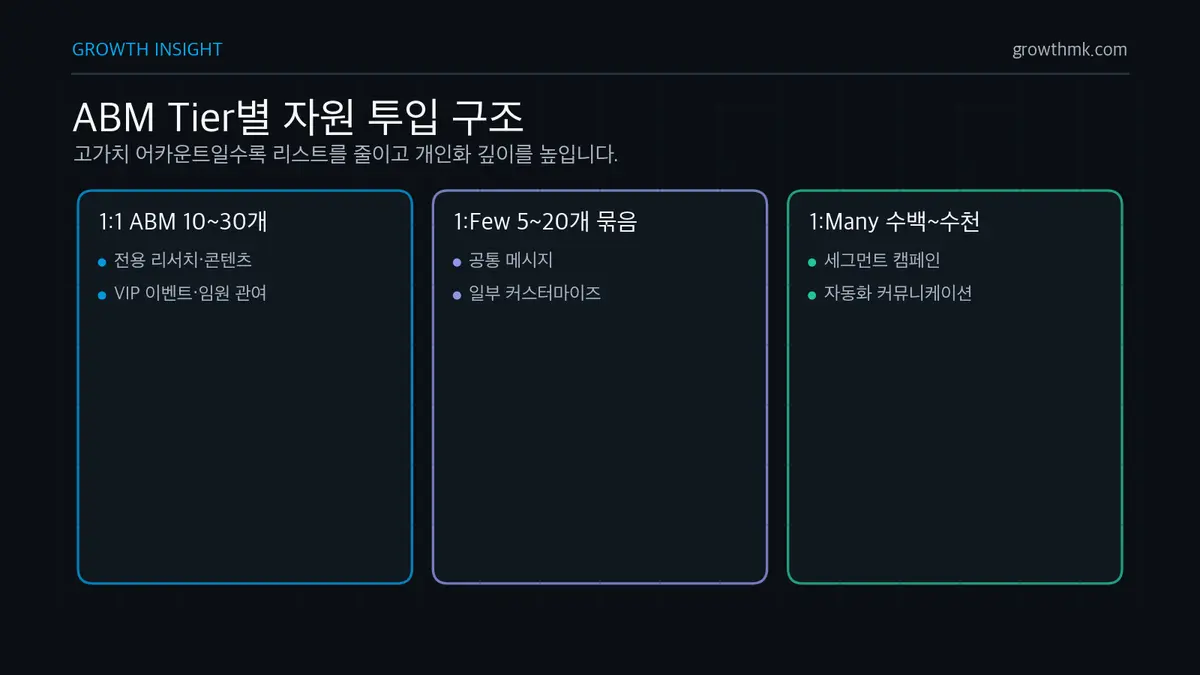
ABM’s tier structure staggers the intensity of resource investment. 1:1 ABM designs dedicated research, dedicated content, dedicated events, and a dedicated sales play for a single account — typically applied to the top 10-30 accounts. 1:Few ABM groups 5-20 accounts into a single cluster, running shared messaging and campaigns while customizing some elements. 1:Many ABM segments hundreds to thousands of accounts and covers them with targeted digital campaigns and automated communication. Most organizations run all three layers simultaneously, allocating resource weight differently by tier.
| Tier | Number of accounts | Resource investment | Main tactics | Operating rhythm |
|---|---|---|---|---|
| Tier 1 (1:1) | 10-30 | Very high | Dedicated research, custom content, VIP events, executive engagement | Quarterly to semiannual plan |
| Tier 2 (1:Few) | 30-100 | Medium to high | Industry/use-case campaigns, small roundtables, industry reports | Monthly campaigns |
| Tier 3 (1:Many) | 100 to several thousand | Medium | Digital ad targeting, email sequences, programmatic ABM | Always-on |
ABM’s success depends on joint ownership between sales and marketing. A structure where marketing alone pulls together an account list and hands it to sales fails. Sales has a sense of ownership over the accounts they’re targeting, and marketing has the activity data from other parts of the organization (intent, website behavior, event attendance). Only when the two pieces of information combine does account selection, planning, and execution align. Typically this means holding a joint planning session every quarter to update the tier list, and checking per-account progress at a weekly standup.
Intent data is a growing factor in ABM. Services like Bombora, 6sense, and G2 Buyer Intent aggregate and surface which keywords, categories, and competitors a target account has been researching recently. If a specific conglomerate affiliate is heavily searching “marketing automation comparison” or “HubSpot vs. Marketo,” for example, that’s the golden window for outreach. The core of ABM orchestration is concentrating custom content, email, LinkedIn Ads, and sales outreach simultaneously on accounts whose intent signal has risen.
ABM measurement differs from traditional MQL-count-centric metrics. The core metrics are account coverage (the share of the target list actually engaged), account engagement score (a composite of visits, content consumption, email response, and event attendance), pipeline generation (number of open deals within target accounts), deal velocity (average close time within an account), and deal size (average contract size for target accounts). Because a single account often moves slowly for six months and then converts all at once, it’s better to watch the pattern on a quarterly or semiannual basis rather than getting emotional about monthly numbers. What Is ABM?
Avoid three common mistakes when adopting ABM. First, starting with too large a list. Declare you’ll run 100 accounts as 1:1 and you’ll burn out within 90 days. Starting with 20-30, building operating muscle, and then expanding is far faster in the long run. Second, mistaking content customization for “swapping in the account’s logo.” Real customization means studying the account’s business context, recent events, and executive statements and adjusting the message structure itself. Third, having sales treat ABM as “marketing’s event.” Design ABM as a joint sales-marketing project, tied to shared KPIs, and it sustains itself.
5. Lead Generation and Lead Nurturing — The MQL, SQL, and PQL Flow
Lead generation refers to every activity that captures a prospect’s contact information and context. But contact information alone isn’t enough for sales to act on. Leads are categorized by quality and readiness into MQL, SQL, and PQL, and how you define and move each stage decides whether your B2B pipeline lives or dies. The key isn’t pulling in a large volume of leads — it’s handing the right lead to sales at the right time.
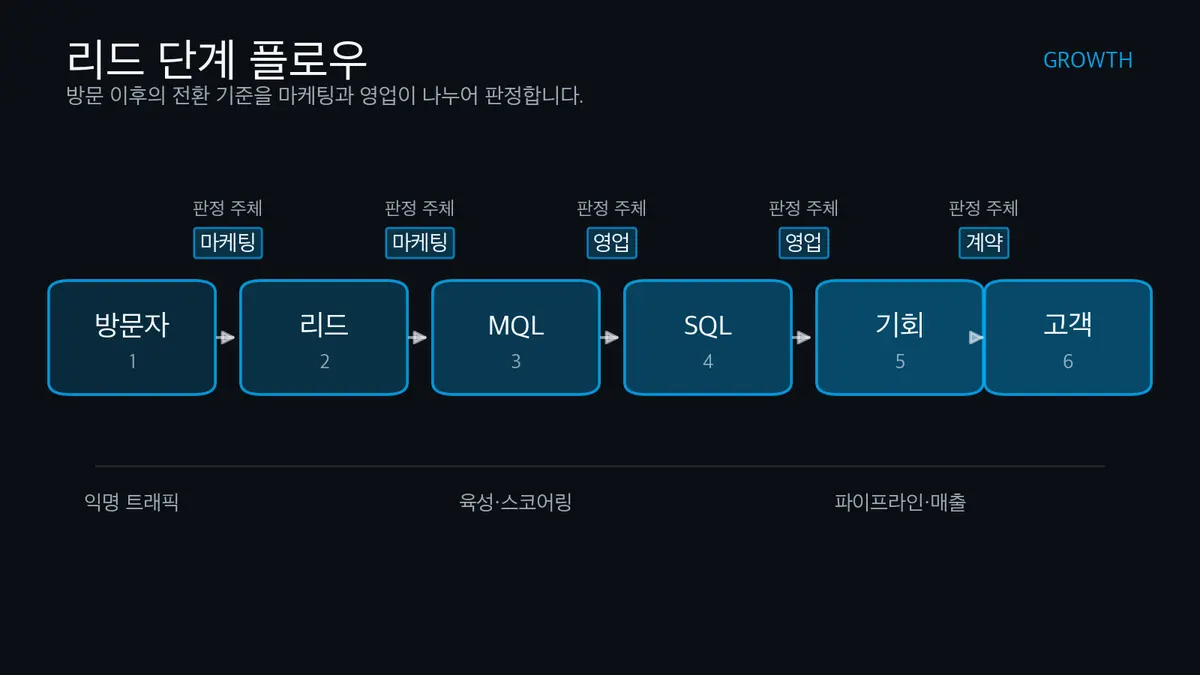
An MQL (Marketing Qualified Lead) is a lead that, through marketing activity, has reached “a level of interest worth sales engaging with.” Criteria differ by organization, but a lead is typically classified as an MQL when they’ve downloaded specific content, requested a demo, visited the pricing page multiple times, or attended a webinar. Some organizations exclude plain newsletter subscribers from MQL status, counting only leads who show substantive behavior. An SQL (Sales Qualified Lead) is a lead sales has directly contacted, validated against a framework like BANT (budget, authority, need, timeline) or MEDDIC, and confirmed as “capable of developing into a real deal.” MQL-to-SQL conversion rates vary enormously by industry, product, and price point, so there’s no single universal benchmark. Rather than chasing an external average, it’s more practical to build a baseline from your own last 2-4 quarters of data and manage the trend of improvement against that.
PQL (Product Qualified Lead) is a concept that emerged in B2B SaaS. In products offering a free trial or freemium plan, this refers to a lead who has actually used the product and shown behavior indicating “high likelihood of converting to paid.” For example, in a freemium CRM, an account where 3+ team members have been invited, a core feature has been used 3+ times a week, and data integration has been configured, is a PQL. Unlike a traditional MQL, a PQL isn’t centered on an event like “form submission” — it’s centered on “behavior patterns,” which means it can only work when event tracking and product instrumentation are well in place. Lead Generation
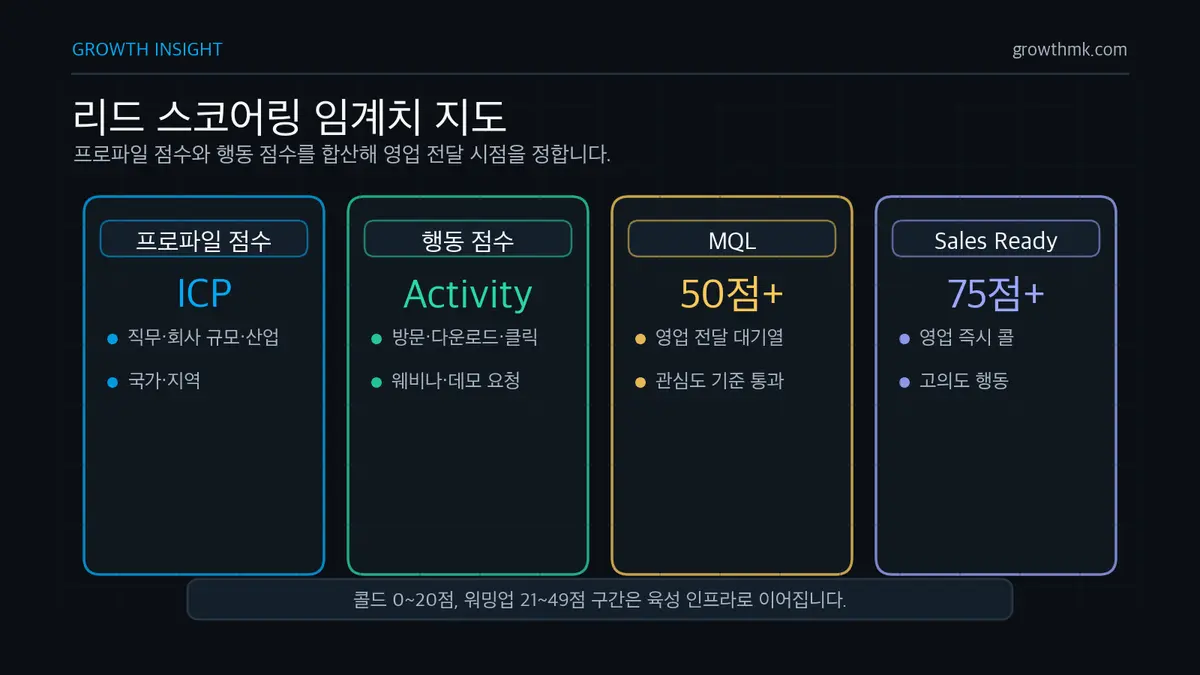
Lead scoring is the method for systematizing MQL, SQL, and PQL conversion. The basic structure is a sum of “profile score + behavior score.” Profile score is how well the lead fits your ICP — company size, industry, job function, location. Behavior score accumulates from activities like website visits, content downloads, email clicks, and demo requests. Based on the score range, leads are classified as cold, warming, MQL, or SQL, and once a given threshold is crossed, they’re automatically passed into the sales CRM.
Below is a simple example of lead-scoring criteria. In actual operation, adjust the weights based on your organization’s ICP and funnel data.
[Profile score]
- Job title: C-level 20 points / VP-level 15 points / Manager 10 points / Individual contributor 5 points / Student, other -10 points
- Company size: 1,000+ employees 15 points / 300-999 10 points / 50-299 5 points / Under 50 0 points
- Industry: Target industry 10 points / Related industry 5 points / Unrelated -10 points
- Country/region: Target market 5 points / Other 0 points / Unserviceable region -20 points

[Behavior score]
- One blog visit: 1 point (up to 5 points)
- Guide download: 5 points
- Pricing page visit: 8 points
- Used comparison chart/calculator: 10 points
- Registered for webinar: 7 points / Attended: +5 points
- Requested a demo: 25 points
- Email open: 0.5 points / Click: 2 points (based on last 30 days)
- 60 days inactive: -10 points

[Thresholds]
- Cold: 0-20 points
- Warming: 21-49 points
- MQL: 50+ points (queued for sales handoff)
- Sales Ready: 75+ points (immediate sales call)
Lead nurturing is the process of sustaining and growing a lead who hasn’t yet reached MQL status through email, retargeting, and content over an extended period. A drip campaign is the core tool for lead nurturing — an automated email sequence that branches by topic interest, industry, and job function. A typical sequence runs: welcome email → deliver a core guide → share a case study → invite to a webinar → introduce the product → propose a 1:1 meeting, with each email’s next path shaped by click and open behavior. The nurturing period can run as short as two weeks or as long as six months or more. This isn’t a one-off campaign — it’s infrastructure that “automatically walks alongside the lead until they’re ready.”
A sales-marketing SLA (Service Level Agreement) is an agreement document between the two organizations. It contains items like: marketing supplies N MQLs per month and maintains a quality standard, sales follows up within N hours and commits to an X%+ MQL-to-SQL conversion rate, and so on. Without an SLA, accountability becomes unclear the moment a lead falls through, and the pipeline leaks. Below is an example of a basic SLA template.
[Marketing → Sales SLA]
1) Monthly MQL supply: 300 per month ± 10%
2) MQL quality standard: profile score 15+, behavior score 35+
3) MQL delivery channel: automatic CRM assignment (round-robin, by region/segment)

[Sales → Marketing SLA]
1) New MQL response time: first contact within 24 business hours
2) Contact attempts: minimum 5 (3 calls + 2 emails), spread over 10 business days
3) Status update: record disposition (SQL/Disqualify/Nurture) for every MQL within 30 days
4) MQL-to-SQL conversion target: 25%+

[Shared]
- Weekly pipeline standup (Tuesday 10:00)
- Quarterly SLA review & adjustment
- Bad-MQL feedback loop (reason code required)
An SLA isn’t a document you write once and leave alone. Review and adjust conversion rate, quality, and speed every quarter. In particular, set the MQL bar too low and sales burns out and feedback deteriorates; set it too high and lead volume falls short. Marketing and sales need to regularly redefine, together, “what does the ideal MQL profile look like this quarter.”
6. B2B Content Marketing — Thought Leadership and Building an Asset
In B2B marketing, content isn’t just blog posts — it’s the infrastructure that props up the entire pipeline. The moment you turn off ads, leads stop, but well-designed content keeps supplying leads for years as it’s searched, shared, and repurposed. Content’s power comes from a structure where “something made once gets consumed repeatedly in various forms.” That’s why content hubs and topic-cluster strategy quickly became standard practice in B2B marketing.
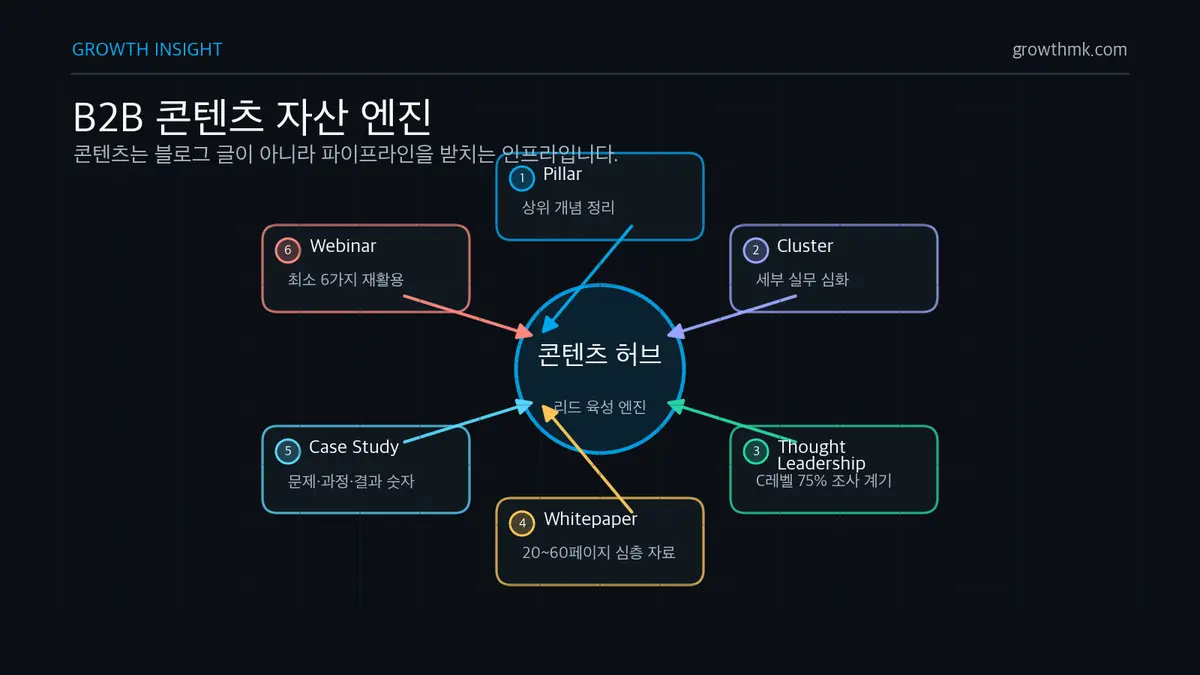
A content hub is a collection of content that covers one subject area in depth. A pillar article comprehensively lays out the top-level concept, and cluster articles beneath it dig into specific practitioner-level topics. Pillars and clusters are strongly connected through internal links, and search engines read that structure as a signal that the site is a topical authority. In practice, it also lets you cover the entire buyer journey within a single hub. Under a “B2B Marketing” hub, for example, sits this pillar article, with clusters underneath covering ABM in depth, a lead-scoring template, LinkedIn Ads setup, alignment SLAs, building a KPI dashboard, and more. Map content to every persona and stage, and the entire site becomes one giant lead-nurturing engine. The Content Marketing Guide
Thought leadership is a content category distinct from product promotion. It interprets industry issues, points toward the future direction, and speaks first on perspectives that haven’t yet entered public discourse. Thought leadership is hard to measure with short-term conversion metrics, but over a 3-5 year horizon, it has a decisive influence on brand awareness, preference, and pricing power. In LinkedIn-Edelman’s research on B2B thought leadership impact, 75% of decision-makers and C-level executives said thought-leadership content had prompted them to research a product or service they hadn’t previously considered, and 9 out of 10 said they were more receptive to sales and marketing outreach from a company that consistently publishes high-quality thought leadership. What matters is that it has to be written by “someone with real thinking behind it.” Content that just cites data with vague conclusions isn’t thought leadership. Writing, interviews, video, and podcasts where executives and subject-matter experts reveal their own point of view are what’s effective.
Whitepapers and eBooks are the traditional heavyweight formats of B2B content marketing. Running 20-60 pages of in-depth material, they capture leads through a download form. A whitepaper tends to address “a structural solution to a specific problem,” while an eBook is closer to “a comprehensive guide to a specific topic.” Production is resource-intensive, but once made, it gets reused dozens of times across email, ads, blog CTAs, and sales proposals. It’s common for one well-made whitepaper to become the single biggest MQL producer of the year.
Case studies are the single most powerful conversion-driving asset in B2B content. They show a real customer’s problem definition, adoption process, and results, backed by concrete numbers. An effective case study follows this structure: customer introduction → pre-adoption situation and pain points → solution selection criteria → adoption process and key decisions → results (numbers) → customer quote → next steps. Present numbers as concretely as possible — “revenue growth” is far less convincing than “38% MQL growth and 22% CAC reduction over six months.” Build up a library of case studies across industries, use cases, and company sizes, and it becomes a reference library sales can pull from to match a prospect’s exact situation. For a strategic breakdown of case studies, see B2B Startup Marketing Case Studies.
We already covered webinars in the channels section, but they’re worth mentioning once more from a content perspective. Run a webinar once and you can generate at least six pieces of derivative content: the recording + a summary blog post + a SlideShare + highlight clips + a newsletter item + a Q&A writeup. “Make it once, use it six times” is at the core of B2B content ROI. Build the repurposing plan into your design from the moment you plan the original content.
Video and podcasts carry a relatively higher barrier to entry, but they have real impact. A YouTube channel functions as a second SEO axis, and building up product explanations, tutorials, and customer interviews on video plays a decisive role in the mid-to-late stages of the buyer journey. A podcast is a format executives and decision-makers listen to during their commute, which makes it well-suited to thought-leadership content aimed at leaders. Invite industry leaders as guests and their network flows in naturally too.
The realistic advice for running content is “quality over quantity, but steady accumulation.” Two high-quality long-form pieces a month beat three low-quality blog posts a week. At the same time, going dark for a few months and then publishing in a burst is bad for both search engines and subscribers. The ideal rhythm is steadily putting out 1-2 quality assets a month and filling the gaps in between with repurposing, newsletters, and short insight posts. Plan your content calendar quarterly, and pre-define the topic owner, interview subject, data source, expected word count, and distribution channel for each piece. To boost production efficiency, it’s also worth setting standards for using generative AI in content marketing.
7. Sales-Marketing Alignment — Smarketing in Practice
One of the biggest variables determining B2B performance is alignment between sales and marketing. When the two organizations operate in isolation, each chasing its own KPIs, leads pile up without converting, and content gets made that sales never uses. HubSpot coined the term “Smarketing” (Sales + Marketing) for this alignment. Well-aligned organizations have consistently, over many years and across numerous industry studies, delivered better results than misaligned ones in pipeline conversion, deal-close speed, and average deal size.
The first step of alignment is sharing an ICP (Ideal Customer Profile) and buyer personas. ICP is “the conditions a company needs to meet to be the best fit for our product,” while a buyer persona is “who within that company we need to convince.” Marketing can only generate leads sales can convert if those leads match the ICP. But if the ICP only lives in a single document that practitioners don’t actually share, diverging interpretations creep in over time. Hold a joint session every quarter where both organizations revisit the ICP together and update it based on “common traits of recently closed-won deals.” B2B Decision-Maker Marketing
Shared KPIs are alignment’s structural mechanism. Set marketing’s KPI purely as “lead count” and you create an incentive to inflate the number regardless of quality. Set sales’ KPI purely as “revenue” and they chase only short-term opportunities while the long-term pipeline dries up. Smarketing organizations set higher-level KPIs shared by both sides — metrics like “pipeline created” (pipeline dollar amount), “closed-won revenue,” and “marketing-influenced revenue.” Individual team KPIs are designed to roll up into these higher-level metrics.
Integrating your CRM and marketing automation is alignment’s technical foundation. HubSpot, notably, bundles marketing, sales, and service into a single platform; Salesforce integrates marketing functionality through Pardot/Marketing Cloud Account Engagement; and Marketo is strong in enterprise B2B automation. Tool choice depends on organization size, price, and sales team needs, but the common principle is that “lead data lives in one place and flows in real time.” When tools are disconnected, data is disconnected too, and disconnected data breeds disputes.
Pipeline collaboration rituals are the step that turns alignment into actual operations. There are three representative rituals. First, a weekly pipeline standup: 30-45 minutes covering the status of your top 10 deals, blockers on stuck deals, content or events marketing can support with, and a review of this week’s MQLs. Second, a monthly SLA review, where the SLA figures covered earlier (MQL count, response speed, MQL-to-SQL conversion rate, quality feedback) get disclosed and adjusted. Third, a quarterly QBR (Quarterly Business Review), where pipeline contribution, campaign ROI, and next quarter’s plan get reviewed together with senior leadership, including executives.
In a well-aligned organization, it doesn’t feel like marketing is “helping” sales — it feels like sales is “leveraging” marketing. Marketing gives sales account-level insights per prospect, intent signals, personalized email templates, and industry benchmark data. Sales shares with marketing the customer’s raw, unfiltered reactions, how often competitors come up, why deals stall, and patterns behind what makes a deal succeed. This two-way data flow feeds directly into upgrading content, campaigns, and product.
Finally, the cultural element can’t be left out. Alignment ultimately starts from a shared belief that “we respect each other and work toward a common goal.” Even with formal KPIs and rituals in place, an environment where each side blames the other or withholds information will still collapse. Leadership needs to publicly emphasize alignment, celebrate joint marketing-sales wins in results-sharing forums, and deliberately design informal touchpoints — joint offsites, meals, events.
8. B2B Marketing KPIs and Measurement — Pipeline, Attribution, Unit Economics
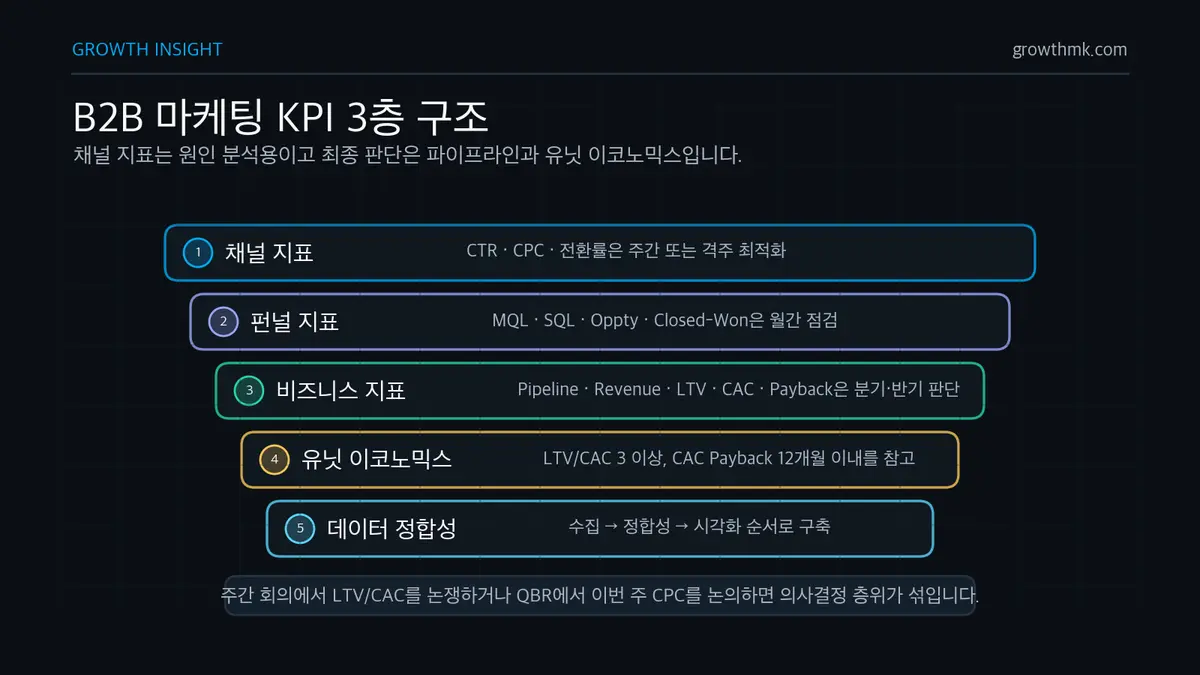
B2B marketing performance can’t be explained by simple channel metrics like CTR and CPC alone. You need to look at how much it ultimately contributed to pipeline and revenue, and whether that contribution is sustainable from a unit economics (LTV/CAC) standpoint. Metrics systems are typically designed in three layers: channel metrics (CTR, CPC, conversion rate) → funnel metrics (MQL, SQL, opportunity, closed-won) → business metrics (pipeline, revenue, LTV, CAC, payback period).
Pipeline contribution and revenue contribution are different things. Pipeline contribution is “the dollar amount of open deals with a marketing touch,” while revenue contribution is “the dollar amount of deals actually closed.” In early-stage B2B, since there aren’t many closes yet, tracking centers on pipeline contribution; mature organizations measure revenue contribution too. Pipeline contribution itself splits into “marketing-sourced” and “marketing-influenced.” The former is a deal where “the lead originated from marketing,” while the latter is a deal where “marketing had a touch somewhere during the deal’s progress.” By definition, influenced is counted far more broadly than sourced, and since the absolute figures vary hugely by your organization’s counting rules, tracking your own trend with a consistent rule matters more than comparing against external numbers.
An attribution model decides how much credit to distribute to each touchpoint when multiple touchpoints contributed to a single conversion. First touch assigns everything to the first touchpoint; last touch assigns everything to the last. Multi-touch models distribute weight. U-shape (position-based) assigns 40% each to first and last touch, and 20% to the touches in between. W-shape gives 30% each to first touch, lead creation, and opportunity creation, distributing the remaining 10% across other touches. Time decay assigns higher weight the closer a touch is to conversion. Data-driven (algorithmic) models learn the weights from actual data.
No attribution model is perfect. Each model has different assumptions, and whichever one you pick, there’s error and bias. What matters is having internal agreement on “here’s how we interpret this model.” For example, a rule like “we report using U-shape, but supplement it with a separate analysis of long-cycle campaign effects (PR, thought leadership, events).” Don’t fixate on a single number — build the habit of cross-verifying through multiple lenses. We cover in detail the distortion that results from treating an ad metric as the single standard in The Trap of ROI and ROAS. Measuring Marketing KPIs
LTV (Lifetime Value) is the total revenue (or total profit) a single customer brings the company over their lifetime. The basic formula is “average annual revenue × average customer retention period × gross margin.” For SaaS, it’s also often estimated as “ARPA × gross margin ÷ churn rate.” CAC (Customer Acquisition Cost) is the marketing plus sales cost of acquiring a single customer, calculated as “marketing and sales spend over a given period ÷ new customers acquired in that same period.” An LTV/CAC ratio of 3 or higher is considered a healthy benchmark for SaaS — David Skok’s SaaS Metrics 2.0 notes that top-tier SaaS companies exceed an LTV/CAC of 3, sometimes reaching 7-8. Payback period is “CAC divided by monthly revenue (or profit)”; the same source treats 12 months as the threshold and finds the top-tier companies recover CAC within 5-7 months.
Win rate is calculated as “closed-won ÷ (closed-won + closed-lost).” Break it down by pipeline stage to see stage-level win rates, and you can diagnose exactly where deals are leaking. Deal velocity measures how quickly deals move through the pipeline, calculated as “average deal size × win rate ÷ average sales cycle length.” Rising velocity means you’re closing bigger deals, faster.
| KPI | Definition | Typical reference range | Purpose |
|---|---|---|---|
| MQL-to-SQL conversion | SQL ÷ MQL | 20-30% | Checking lead quality/SLA |
| SQL-to-opportunity conversion | Opportunity ÷ SQL | 50-70% | Verifying sales qualification quality |
| Opportunity-to-won conversion (win rate) | Closed-won ÷ (won + lost) | 15-30% | Proposal/closing capability |
| Pipeline coverage | Open pipeline ÷ quarterly quota | 3-5x | Likelihood of hitting the goal |
| LTV/CAC | LTV ÷ CAC | 3+ | Sustainability of growth |
| CAC payback | CAC ÷ monthly revenue (or profit) | Within 12 months | Cash efficiency |
| Deal velocity | (Number of opportunities × average deal size × win rate) ÷ sales cycle | Rising trend | Pipeline speed |
| NRR (Net Revenue Retention) | (Existing revenue + expansion – churn) ÷ existing revenue | 110%+ | SaaS expandability |
The ranges above are empirical industry reference points, and they vary considerably by sector, deal size, market maturity, and how you count. Treat them not as an absolute standard but as a starting point for reading your own trend line. The LTV/CAC and CAC payback benchmarks are drawn from David Skok’s SaaS Metrics 2.0, and NRR distribution from Bessemer Venture Partners’ cloud benchmarks.
One thing to watch when measuring KPIs is Goodhart’s Law: the moment a metric becomes a target, it stops being a good metric. Set MQL count as a KPI, for instance, and marketing gains an incentive to hit the number even at the expense of quality. So always interpret individual metrics as connected to, and subordinate to, higher-level business metrics (revenue, LTV/CAC). Executive reports should surface business metrics before channel metrics, keeping channel metrics one level down for root-cause analysis.
Surprisingly, data integrity is one of the more important pieces of a measurement system. If the lead-source field in your CRM sits empty, UTM parameters go missing at form submission, or sales enters stage manually and inconsistently, no dashboard means anything. So build your measurement infrastructure in the order “collection → integrity → visualization.” At the collection stage, enforce UTM rules on every form and CTA; at the integrity stage, run a monthly data-validation checklist (empty fields, duplicate leads, skipped stages); and only at the visualization stage do you start worrying about dashboard design. Do it in reverse order and you get incorrect numbers sitting on top of a beautiful-looking dashboard, over and over. We cover separately why tracking infrastructure is a prerequisite for B2B performance measurement in Why Tracking Tool Setup Matters for B2B Marketing.
Reporting cadence should also match each metric’s character. Channel metrics (CTR, CPC, conversion rate) get watched weekly or biweekly for rapid optimization. Funnel metrics (MQL, SQL, win rate) get watched monthly. Business metrics (pipeline sourced, LTV/CAC, payback) get watched quarterly or semiannually. It’s critical not to confuse which metric belongs to which cadence. Argue about LTV/CAC in a weekly meeting and no meaningful improvement happens; discuss this week’s CPC at a quarterly QBR and leadership can’t make strategic calls. Design your dashboard and report structure so each metric’s cadence and owner map precisely.
9. B2B SaaS vs. Traditional B2B Services — PLG and Land-and-Expand
Even within B2B, the marketing mechanics of SaaS differ considerably from traditional services (consulting, agencies, systems integration, large-scale enterprise software). Because the product itself becomes the experience in SaaS, PLG (Product-Led Growth) — using the product itself as a marketing channel — has flourished. In traditional services, the people are the product, so a relationship-, reference-, and proposal-centered sales-led model remains powerful.
PLG’s core principle is that “the product usage experience becomes the primary evidence for the purchase decision.” Slack, Dropbox, Figma, and Notion are the classic PLG success stories. Users try the product directly through a trial or freemium plan, feel the value, and then spread it through their team. Marketing maximizes trial conversion on the website; the product handles onboarding, reaching the core value (“aha moment”), network effects, and paid conversion. Sales approaches accounts that show team growth or specific behavior patterns during the trial through “expansion sales.”
Choosing between a trial and a freemium model depends on the product’s character. A time-limited trial (14-day, 30-day) suits products where value becomes clear quickly, while freemium (limited features or usage) suits products with network effects or where team-wide spread happens naturally. Hybrid models are common too — freemium as the base, with a paid trial offered once usage crosses a certain threshold. Whichever model you use, you need to define a clear “moment of paid conversion.” Hooks that drive that conversion vary — team invites, storage capacity, API call count, access to advanced features. What Is Growth Hacking?
Land-and-expand is the growth engine of B2B SaaS. “Land” means the first purchase, usually starting with one department, one team, a handful of users. “Expand” is the subsequent stage of spreading to other departments, other teams, and more users. NRR (Net Revenue Retention) is the core metric measuring this strategy’s success. An NRR above 100% means revenue grows from existing customers alone. Bessemer Venture Partners’ cloud company benchmarks put the average NRR by ARR size bracket at 120-140%, classifying 130%+ as best-in-class at the larger scale brackets.
Marketing and CS (Customer Success) work together to drive expansion. Marketing provides customer newsletters, product updates, a user community, and educational content. CS monitors usage data to catch expansion opportunities — features useful to other teams, patterns of rising usage. Sales takes that signal and pursues the expansion proposal. In this structure, marketing has to allocate resources to “spreading existing customer success stories” just as much as to “generating new leads.”
Traditional B2B services, conversely, treat the sales relationship as the product’s essence. Consulting projects, ad agency work, systems integration, and large-scale software licenses all create value through people getting involved. In this market, marketing’s role is mainly to “open the door for sales.” Build the brand through thought-leadership content, generate meetings through relationship-based events, and build proposal-stage trust through references and case studies. PLG elements like public pricing and self-serve signup don’t work here. Instead, 1:1 custom proposals, long-term customer relationships, and executive networking are the core.
The two models aren’t fully separate — they’re a spectrum. Many organizations operate a hybrid, applying PLG to SMB, hybrid to mid-market, and sales-led to enterprise, for example. In this case, marketing, sales, and product run separate playbooks tailored to each segment. Design SLAs, content, pricing, and service level differently by segment, and internal confusion is avoided.
10. The Particulars of the Korean B2B Market — Culture, Trade Shows, Headquarters-vs-Local Structure
Global B2B marketing theory alone isn’t enough to succeed in the Korean market. The Korean B2B market is a unique environment combining a conglomerate-centric decision-making structure, hierarchy and formal-relationship culture, the strong influence of industry trade shows and exhibitions, and the complexity of headquarters-local subsidiary relationships. Ignore these traits and transplant a global playbook wholesale, and the same failure pattern repeats — especially when a foreign vendor runs its Korea office.
The first particular is a conglomerate/group-centric structure. The top 30-50 conglomerate groups account for a substantial share of the B2B market, and inter-affiliate transactions, headquarters-to-subsidiary approval structures, and group-wide procurement policy are all intricately intertwined within a group. Getting into one affiliate carries both the opportunity of expanding to other affiliates, and the risk that group-wide policy can halt an individual deal. Marketing needs to invest in group-level thought leadership and relationship-building while still designing customized strategy per affiliate.
The second particular is the importance of formal courtesy and relationships. Executive meetings, dinners, holiday greetings, and CEO visits — relationship rituals like these still play an important role in building trust for a deal. Digital marketing alone struggles to earn a decision-maker’s trust, and at the decisive stage, an offline relationship often becomes the deciding factor. This shouldn’t be reduced to simple “wining and dining” — it should be understood as a formal channel for building relationship capital. Design formal, strategic offline events like official dinners, partner conferences, and executive roundtables.
Third is the standing of trade shows and exhibitions. Korea hosts major industry-specific exhibitions year-round (smart factory, contact center, education, retail, IT exhibitions, for example), and industry practitioners attend them almost as a matter of course. Even as online channels grow, the experience of seeing something firsthand at a booth, exchanging business cards, and setting up follow-up meetings on the spot still accounts for a large share of lead sources. Marketing should treat trade shows not as “an expensive cost” but as “one of the top 3 annual channels,” planning the full funnel — booth design, pre-event invitations, on-site demos, and post-event follow-up.
Fourth is the rapid expansion of the online base. In particular, the weight of search, content, and social media in the Korean B2B market has grown noticeably over the past few years. In the past, it was rare for executives to gather B2B information from LinkedIn or YouTube — now they actively search and share. This trend is a global pattern — Gartner has projected that 80% of B2B sales interactions will happen through digital channels by 2025. Long-form Korean-language B2B content is still relatively scarce, so a properly built Korean-language content hub has an opportunity to capture significant search share with relatively little competition.
Fifth is the headquarters-to-local-subsidiary structure at foreign companies. A Korea office is subordinate to headquarters’ global strategy, but the actual market often doesn’t mesh well with the playbook headquarters designed. Korean customers want Korean-language materials, Korean references, and Korean case studies. The local marketing team has to localize headquarters’ resources while also producing custom content headquarters doesn’t have. Tension between budget approval, brand-guideline compliance, and reflecting local tone is a constant in this process.
Sixth is the weight of public-sector and regulated industries. Industries like public agencies, finance, healthcare, education, and telecom carry specific procedures, regulations, and security requirements attached to any B2B transaction. Public procurement announcements, technical validation, security review, and public-agency-specific contract terms demand an entirely different playbook from private-sector B2B. If you’re targeting these industries, partnering with industry-specialist partners (large-enterprise system integrators, regulatory-specialist consultants) and securing certifications and references matter as much as marketing.
Not ignoring these particulars while still leveraging the strengths of global best practice is both the difficulty and the opportunity of Korean B2B marketing. Build up inbound through a digital-first approach, but invest in offline relationships and trade-show resources in parallel, and build a Korean-language content hub to capture search share early. Internally, clearly define the division of roles among headquarters, the local team, and industry partners to reduce confusion. B2B Marketing Trends
11. Execution Checklist and Next Steps
If you’ve read this far, the full landscape of B2B marketing should be mapped out in your head. This final section turns everything above into an executable checklist. Depending on your organization’s maturity, you can build all of it out at once, or expand it in stages. Use the checklist below as the starting point for quarterly planning to quickly identify the gaps.
Strategic alignment check. Has your ICP and buyer persona been updated in the past six months? Do marketing and sales share the same ICP definition? Can the #1 problem your product solves be expressed clearly in a single sentence? Has your competitive differentiation (positioning) been validated from the buyer’s perspective? Are your playbooks separated by market segment (SMB, mid-market, enterprise)?
Buyer journey coverage check. Does each of Gartner’s six stages have at least two pieces of mapped content? Is there differentiated content per persona (champion, decision maker, influencer, user)? Is your early-stage CTA not uniformly set to “request a demo”? Have you built up at least 5-10 case studies per industry/size segment? Are pricing expectations (transparent disclosure, disclosed on request, custom quote) clearly managed?
Channel portfolio check. Have your 2-3 core channels reached critical mass (search rankings, newsletter subscribers, ad budget)? Are 1-2 long-term investment channels (content, PR, community) getting steady resource allocation? Is there a rhythm of testing one experimental channel (new platform/format) every quarter? Are paid channels paired with an organic asset? Are events and webinars designed with the full funnel (invite-run-record-repurpose)?
ABM readiness check. Is your Tier 1/2/3 account list updated every quarter? Are you collecting at least one form of intent data (or a substitute signal)? Is champion/influencer/decision-maker mapping documented for every Tier 1 account? Does joint ABM planning between sales and marketing run on a weekly rhythm? Are ABM campaign success metrics (account engagement, pipeline generation) defined?
Lead operations check. Is your lead-scoring model documented and implemented in the CRM? Are MQL/SQL/PQL definitions shared across the whole team? Are at least 3-5 drip campaigns running, with a performance review every quarter? Does an SLA exist with monthly reviews happening? Does the “bad-MQL feedback loop” actually run (sales records reason codes, marketing sees them and adjusts)?
Content infrastructure check. Is at least one pillar-and-cluster content hub built? Are 1-2 new pillars or major clusters being added each quarter? Is your library of whitepapers, eBooks, and case studies managed in a form sales can access? Is thought-leadership content (from executives/experts) published at least once a month? Is a process defined for recording and repurposing webinars and events?
Alignment/operations check. Are shared marketing-sales KPIs defined? Do the rituals exist — weekly standup, monthly SLA review, quarterly QBR? Are your CRM and marketing automation integrated so data flows in one place? Is lead-quality feedback run as a learning session rather than a blame session? Is a data-analysis owner (dedicated or part-time) designated within the marketing team?
Measurement/reporting check. Is pipeline contribution (sourced/influenced) included in your monthly report? Is an attribution model (e.g., U-shape) set, with organizational agreement on it? Are LTV, CAC, and payback period calculated and reported to leadership every quarter? Does your dashboard reflect the three-layer structure of channel/funnel/business metrics? Is win/loss analysis conducted every quarter?
If a lot of items on this checklist are blank, don’t try to fill everything at once — pick 3-5 areas per quarter and reinforce them deeply. Identifying the “3 weakest areas” every quarter and investing heavily in them next quarter is sustainable. At the same time, be careful not to neglect areas where you already have strength. Sacrificing existing strengths to fill weaknesses shakes the whole pipeline.
Here’s the recommended execution order for next steps. First, run a source analysis of your current pipeline — pull the source, touchpoints, and average cycle for closed-won and closed-lost deals from the past 12 months. Second, update your ICP and buyer personas as a document — spend 2-3 focused hours on a joint marketing-sales session. Third, map your existing content against the buyer journey matrix (stage × persona) and identify the gaps. Fourth, rebalance your channel portfolio — reallocate budget based on last quarter’s contribution and CAC. Fifth, put your SLA and shared KPIs in order. Sixth, select your first Tier 1 ABM list of 20-30 accounts and launch a pilot. Execute these six steps within 90-180 days, and by the next quarter you can move on to higher-level topics like PLG, NRR, and advanced attribution.
Finally, remember that B2B marketing is a long game. Content you start this week brings in leads 12 months from now; the ABM infrastructure you build today reliably produces enterprise deals two years from now. The team that stays steady through short-term metric swings and keeps consistently building structural assets is the one that wins in the end. We hope this pillar guide helps you build the skeleton of that accumulation. Adjust the framework to fit your organization’s situation and industry, and follow through into the details via the deeper articles at the end of each section, and your B2B marketing engine will settle into place on solid ground. Setting B2B Marketing KPIs
Need a partner to design your B2B pipeline with you? Growth designs B2B marketing built on customer journey analysis and data-driven experimentation to bring in “the one person who becomes revenue,” not just traffic. See our approach in our B2B Marketing service overview, or reach out via Contact Us if you need a diagnosis of your organization’s pipeline.
Frequently Asked Questions (FAQ)
What should a B2B company do first when starting marketing?
The sequence is four steps. ① Trace back the source, touchpoints, and sales cycle of deals closed in the past 12 months. ② Document your ICP (Ideal Customer Profile) and buying-committee personas. ③ Map your existing content against each stage of the buyer journey to find the gaps. ④ Build 2-3 core channels and a measurement system (UTM, CRM integration). Rather than launching every channel at once, it’s safer to start with channels where assets accumulate — search, content, email — and expand quarter by quarter. Increasing budget before you can measure anything is the most common failure pattern.
How should I set a B2B marketing budget?
There’s no single ratio that works for every company — working backward from your pipeline goal is the most sensible approach. Work back through quarterly revenue goal ÷ average deal size ÷ win rate ÷ MQL-to-SQL conversion rate, and you get the required lead count and the allowable CPL per channel. From there, separate your budget into short-term-conversion spend and long-term-asset (content, brand, PR) spend, and cap new-channel experiments at 5-10% of the total — and you get a structure that isn’t rattled by volatility.
How long does it typically take to see results?
Every channel has a different rhythm. Paid ads show signal within 1-3 months, but organic content needs a 6-12 month accumulation window, and ABM has to be evaluated on a quarterly to semiannual basis. Since the B2B purchase cycle itself runs 3-12 months, it’s important to first align expectations with leadership on the premise that revenue contribution from activity you start this quarter typically shows up 2-4 quarters later. Look only at short-term metrics and shut down a long-term channel, and you cut off the pipeline’s future supply.
Which channel should I prioritize first?
If you already have deal data, the principle is to trace back the first touch and mid-journey touches of recently closed-won deals and reinforce whichever channel’s contribution is already validated. For an early-stage organization without data, a combination that centers on search (SEO, search ads) — where purchase intent is clear — and email for nurturing, with LinkedIn and webinars as a supplement, has a lower failure probability. It’s best not to add more channels until your 2-3 core channels have crossed critical mass.
Should B2B marketing be handled by an agency or in-house?
There are three criteria. ① Do you have in-house strategy, content, and data capability? ② Can you secure the resources to execute consistently for six months or more? ③ Can you build a measurement system — CRM, tracking — yourself? If two or more of these are missing, a hybrid approach is realistic: work with outside experts on initial strategy design and building the execution system, while gradually internalizing operational capability. If you’re choosing an agency, confirm they’re the kind of partner who proposes measuring pipeline and revenue contribution together, not just lead “count.”
Related Reading